


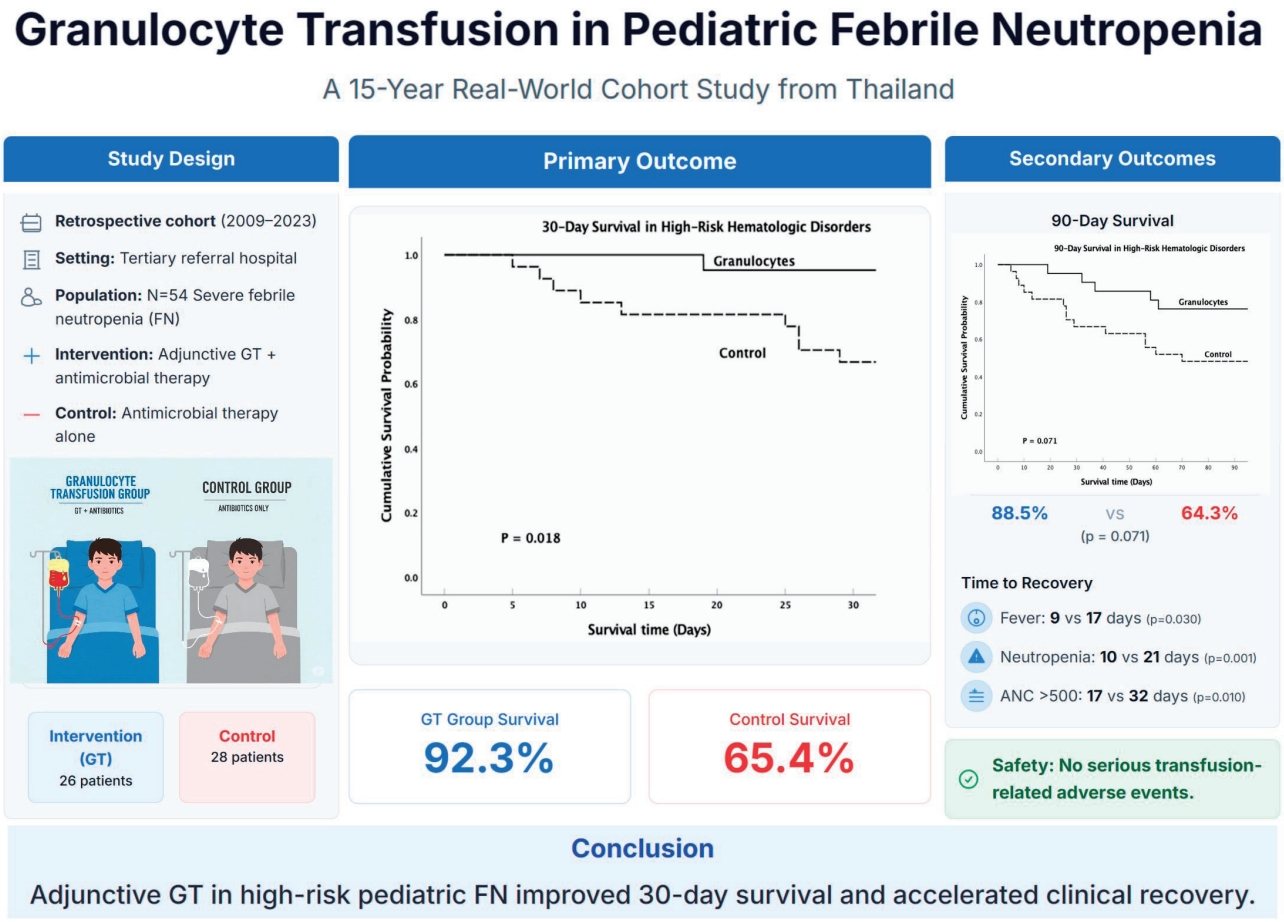
Graphical abstract. GT, granulocyte transfusion; ANC, absolute neutrophil count.
Introduction
Febrile neutropenia (FN) is a life-threatening complication in pediatric patients with high-risk hematologic disorders, typically resulting from chemotherapy-induced bone marrow suppression. Up to 10 to 50% of neutropenic episodes are complicated by fever, substantially contributing to infection-related morbidity and mortality [1-4]. In Thailand, a retrospective study at Bhumibol Adulyadej Hospital (2012–2018) reported an incidence of FN of 5.58 per 1,000 chemotherapy days and a 24% mortality rate among pediatric oncology patients under 15 years of age [5]. These findings underscore the urgent need for improved infection management strategies, particularly in low- and middle-income countries (LMICs), where antimicrobial resistance patterns differ from high-income settings. Severe FN is defined by a sustained oral or axillary temperature ≥38.0°C for ≥1 hour, or a single reading ≥38.3°C, in the presence of an absolute neutrophil count (ANC) <500 cells/mm3 [3,6,7], The risk of invasive infections increases markedly with prolonged (>5 weeks) or profound neutropenia (ANC<100 cells/mm³) [8-11]. Prompt recognition and initiation of empiric broad-spectrum antibiotics are essential to reduce infection-related mortality [12-15]. Although Gram-positive pathogens are more prevalent in high-income countries, Gram-negative and multidrug-resistant (MDR) organisms dominate in LMICs, including Thailand, complicating empirical treatment [16-18].
Granulocyte transfusion (GT) is an adjunctive therapy in patients with persistent or severe infections despite optimized antimicrobial therapy [19-21]. By restoring transient neutrophil function, GT aims to bridge the critical period of neutropenia. According to the 2022 NHS Blood and Transplant Guidelines, GT is indicated for selected patients with severe neutropenia and ongoing infection, particularly when hematologic recovery is expected [22]. GT may also be considered for refractory invasive fungal infections based on clinical assessment.
Despite increasing interest, the clinical role of GT in pediatric FN remains unclear, particularly in LMICs where standardized protocols and prospective data are limited. In Thailand, there are no national guidelines. We conducted a 15-year retrospective cohort study at Siriraj Hospital, comparing outcomes in high-risk pediatric patients who received GT versus antimicrobial therapy alone. This study evaluates the effectiveness, timing, and safety of GT in a real-world LMIC setting.
Methods
1. Study design and population
This retrospective cohort study was conducted at Siriraj Hospital, Thailand’s largest tertiary referral center, and included pediatric patients (≤18 years) with severe neutropenic infections admitted between January 2009 and July 2023. The study was approved by the Siriraj Institutional Review Board (SIRB Protocol No. 364/2566 [IRB4]).
1) GT group
Twenty-eight consecutive patients who received ≥1 GT alongside standard antimicrobial therapy were included. In 2018, routine GT use was formally integrated into institutional practice as part of a multidisciplinary infection management protocol. Two patients with early death (<24 hours after the first GT) were excluded from the outcome analysis due to insufficient exposure to assess efficacy.
2) Control group
Between 2009 and 2023, 30 pediatric patients who received standard antimicrobial therapy alone were selected as historical or contemporaneous controls. All met identical clinical and microbiological inclusion criteria but did not receive GT due to clinical judgment, unavailability, or early mortality prior to GT consideration. Control selection was based on matched disease severity and infection characteristics to minimize temporal and selection bias.
2. Study context and methodological considerations
This cohort reflects the real-world implementation of GT in a resource-limited LMIC setting. Although most GT recipients were treated after 2018 and controls before 2018, institutional FN protocols, antimicrobial regimens, and intensive care unit practices remained consistent throughout the study period. Minor adjustments in antimicrobial agents or critical care technologies were applied based on clinical need and did not differ systematically between groups. To address potential confounders, multivariate logistic regression models were constructed adjusting for baseline ANC, MDR status, infection type, and disease status.
3. Inclusion and exclusion criteria
GT was considered based on a standardized institutional protocol implemented in 2018, which included the following indications: ANC<500 cells/mm3, receipt of active treatment aiming for remission or recovery, proven or probable invasive infection unresponsive to appropriate antimicrobial therapy, and anticipated marrow recovery in the near future. Exclusion criteria included irreversible marrow failure with no further treatment, non-neutropenic sepsis, pyrexia of unknown origin, and isolated viral infection.
Eligible patients were ≤18 years with severe neutropenia (ANC<500 cells/mm³) due to chemotherapy, hematopoietic stem cell transplantation (HSCT), or marrow failure. The infections were microbiologically documented or clinically suspected and refractory to initial therapy. Bacterial cases required ≥48 hours of persistent fever; fungal cases were defined clinically with supportive imaging/labs. Exclusion criteria included early death (<24 hours), incomplete data, ineligible diagnoses, or neutrophil dysfunction. The full criteria are in Supplementary Tables 1 and 2.
4. GT procedure and institutional protocol
GTs were administered according to a standardized institutional protocol implemented in 2018, with product preparation performed by the Department of Transfusion Medicine. Two types of product were used: (1) pooled granulocytes from leukocyte-depleted platelet concentrates, and (2) apheresis-derived single-donor units. The pooled units were prepared from 4 ABO-compatible whole blood donors screened for human immunodeficiency virus, hepatitis B virus, hepatitis C virus, and syphilis. Buffy coat remnants were separated, processed with platelet additive solution, centrifuged using an inverted technique, irradiated (25 Gy), and transfused within 24 hours. No mobilizing agents were used. For apheresis units, healthy donors underwent infectious screening and crossmatching, then received filgrastim (10 μg/kg subcutaneously) and dexamethasone (8 mg intravenously [IV]) one day earlier. Standard leukapheresis targeted a granulocyte yield ≥1×10¹⁰ cells. Units were leukoreduced, irradiated and transfused within 24 hours. Premedication included chlorpheniramine (0.1–0.15 mg/kg IV) and dexamethasone (0.1 mg/kg IV). All transfusions were administered over a 4-hour period with continuous monitoring. Additional details are provided in Supplementary Table 3.
5. Data collection
We retrospectively extracted clinical data from electronic medical records, including baseline demographics, primary diagnosis, ANC at febrile onset, infection characteristics, and treatment details. Key variables included:
(1) Infection-related variables: source of infection, pathogen type, MDR status, and fungal versus bacterial classification.
(2) Treatment-related variables: antimicrobial regimens, use of granulocyte colony-stimulating factor (G-CSF) and duration of G-CSF therapy.
(3) GT-specific variables: donor type (apheresis-derived, buffy coat-derived, or mixed), timing of GT relative to FN onset (≤3 days, 4–7 days, or >7 days), number of GTs administered, cumulative granulocyte dose (×1010 cells/kg), and premedications administered before transfusion.
(4) Adverse events: nonhemolytic febrile reactions, allergic reactions, transfusion-related acute lung injury (TRALI), cytomegalovirus (CMV) reactivation, and alloimmunization.
6. Outcomes and analysis
Primary outcome: 30-day overall survival
Secondary outcomes: (1) 90-day overall survival, (2) time to fever resolution, (3) time to FN recovery, (4) time to ANC recovery, (5) incidence and types of transfusion-related adverse events
In addition to the predefined primary and secondary outcomes, prespecified subgroup and exploratory analyses were carried out to examine the effect of GT in various clinical circumstances (e.g., transplant status, hematologic risk, type of infection, pattern of resistance, and host factors). To keep things concise, summary findings alone are included in the principal results, but detailed model specifications and results are provided in the Supplementary Material (Supplementary Tables 2, 4–10; Supplementary Figs. 1 and 2).
7. Statistical analysis
Descriptive statistics summarized baseline characteristics. Categorical variables were contrasted by chi-square or Fisher exact tests, and continuous variables by the Mann-Whitney U test. Survival endpoints were compared using Kaplan-Meier curves with log-rank tests, multivariable logistic regression, and Cox proportional hazards models adjusted for clinically significant covariates. To adjust for potential bias and confounding, propensity score matching (PSM) and inverse probability of treatment weighting (IPTW) with stabilized weights were used. Sensitivity analysis by landmark analysis, E-value estimation, and doubly robust models was done to examine robustness of results. Detailed analytic steps and supplementary results appear in Supplementary Text 1 and Supplementary Tables 6, 10–12.
8. Definitions
Severe FN was defined as a single oral temperature ≥38.3°C or a sustained temperature ≥38.0°C for at least one hour, with an ANC <500 cells/mm³ [23]. MDR infection followed CDC criteria: resistance to ≥1 agent in ≥3 antimicrobial classes. The definitions for remission status, infection source and the GT parameters are detailed in Supplementary Table 13.
Results
1. Patient characteristics
A total of 58 pediatric patients with severe neutropenic infections were initially identified, comprising 30 in the control group and 28 in the GT group. Four patients (2 from each group) who died within 24 hours after initiating treatment were excluded, resulting in a final analytic cohort of 54 patients (GT, n=26; control, n=28).
Baseline demographic and clinical characteristics were comparable between the groups, including age, sex, body surface area, underlying hematologic diagnoses, duration and etiology of neutropenia, initial ANC, and the use of G-CSF. Most patients had high-risk hematologic disorders, and the distribution of disease stage and prior treatment exposure was similar between groups. The causes of neutropenia included intensive chemotherapy, HSCT, and primary marrow failure syndromes. G-CSF was administered in both groups with comparable baseline usage rates (Table 1).
2. GT characteristics, timing, and safety
Among the 26 patients who received GT, most had high-risk hematologic disorders, including acute myeloid leukemia (n=9), acute lymphoblastic leukemia (n=6), biphenotypic leukemia (n=1), and severe aplastic anemia (n=5). Three patients had undergone HSCT. The median age at transfusion was 8.7 (range, 0.8–16.9) years, and the median duration of neutropenia before GT initiation was 16 (range, 2–88) days. The median ANC at the time of transfusion was 10 cells/mm³.
Donor sources included apheresis (42.3%), pooled buffy coat donation (42.3%), or both (15.4%). The median number of transfusions per patient was 2 (range, 1–13), with a median granulocyte dose of 0.1727 × 10¹⁰ cells/kg. Transfusions were administered on consecutive days. Twenty-two patients received a single course of GT, while 4 patients received multiple courses for separate infection episodes. To maintain consistency in outcome attribution, only the final course was included in the outcome analyses.
GT was well tolerated in all cases. No serious transfusion-related adverse events (SAEs) were reported, including TRALI, anaphylaxis, hemolysis, or alloimmunization. One patient developed transient fever during infusion, which was attributed to concurrent infection. Among 15 patients monitored for CMV reactivation, 1 case (6.7%) of asymptomatic reactivation without organ involvement was observed.
The effect of GT timing on survival was explored using stratified analysis. No deaths occurred among patients receiving GT within 3 days or after 7 days of FN onset. However, a 29% 30-day mortality rate was observed among those receiving GT between days 4–7 (P=0.053), potentially reflecting indication bias, as sicker patients may have received delayed transfusions (Supplementary Tables 14 and 15).
3. Infection characteristics and G-CSF use
Infectious profiles and antimicrobial resistance patterns were evaluated and found to be comparable between the GT and control groups. In the GT group, the most common infection sites were sepsis of unknown origin (31%), disseminated infection (19%), and skin/soft tissue infection (16%). Bacterial infections accounted for 54% of cases and were equally distributed between Gram-positive and Gram-negative organisms. Fungal infections were present in 33% of GT patients, with candidemia (63%) and invasive pulmonary aspergillosis (37%) being predominant. Mixed infections were observed in 13% of cases. Notably, MDR Gram-positive pathogens (e.g., vancomycin-resistant enterococcus (VRE), MDR viridans streptococci) were detected only in the GT group. In contrast, among control patients, sepsis of unknown origin (39%) and skin/soft tissue infections (25%) were most frequent; fungal infections occurred in 38% (primarily pulmonary aspergillosis, 74%), and Gram-negative organisms accounted for 75% of bacterial infections. MDR pathogens were identified in 25% of control cases and all were MDR Gram-negative (Table 2).
In addition, the use of G-CSF was analyzed to assess its potential interaction with GT. The rate of G-CSF administration was similar between the GT and control groups (58% vs. 46%, respectively; P=0.408). There were no significant differences in the duration of G-CSF therapy (median, 7 days vs. 8 days; P=0.595) or the total G-CSF dose per kilogram (median, 8.33 ×10⁶/kg vs. 6.37 ×10⁶/kg; P=0.489) (Supplementary Tables 16 and 17; Supplementary Figs. 3 and 4). Although univariate analysis indicated that high-dose G-CSF might be associated with improved 30-day survival (P=0.029), this finding was not sustained in multivariate models adjusting for GT (adjusted OR, 0.42; P=0.512), and no significant interaction between GT and G-CSF dose was detected (P=0.999) (Supplementary Tables 18 and 19). This suggests that the survival benefit observed in our cohort is attributable primarily to GT rather than differences in G-CSF use.
4. Primary outcome: 30-day survival
1) Full cohort analysis (n=54)
In the full cohort of 54 pediatric patients with severe neutropenic infections, GT was significantly associated with improved 30-day survival. Multivariate logistic regression adjusting for fungal infection, MDR bacterial infection, and baseline ANC revealed that GT independently reduced the risk of 30-day mortality (odds ratio [OR], 0.105; 95% confidence interval [CI], 0.016–0.700; P=0.020). Similarly, multivariate Cox regression supported a significant survival benefit with GT (hazard ratio [HR], 0.191; 95% CI, 0.041–0.885; P=0.034) (Table 3).
Unadjusted Kaplan-Meier analysis demonstrated higher 30-day survival among GT recipients compared to controls (76.9% vs. 50.0%, log-rank P=0.035), and this benefit remained robust in the PSM analysis. In the matched cohort (n=26 pairs), GT was associated with improved 30-day survival (92.3% vs. 65.4%) with an OR of 0.157 (95% CI, 0.022–0.706; P=0.028) and HR of 0.191 (95% CI, 0.041–0.885; P=0.034) (Supplementary Table 5–5.1). Covariate balance before and after matching is shown in Supplementary Fig. 5.
A composite outcome of death or failure to achieve recovery by day 30 was also evaluated. GT was significantly associated with improved composite outcomes (adjusted OR, 7.89; P=0.011), while fungal infection showed a borderline negative effect (P=0.050) (Table 3; Supplementary Fig. 6).
2) Subgroup analyses
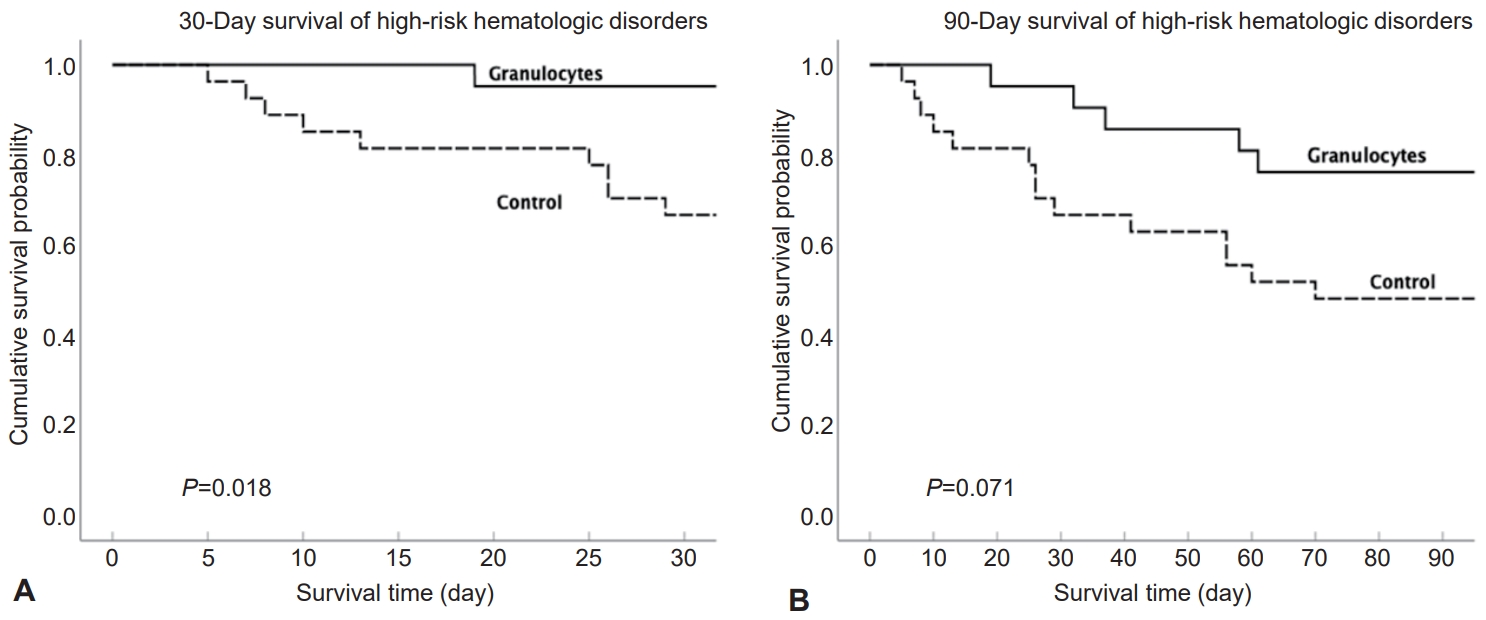
Subgroup analyses confirmed that GT was independently associated with improved 30-day survival in non-HSCT individuals, whilst fungal disease and active disease predicted adverse outcomes (Supplementary Table 4). In high-risk hematologic disease, GT offered a constant survival benefit, for which PSM offered supporting proof, with Kaplan-Meier analysis showing significantly improved 30-day survival and a beneficial 90-day trend (Table 3; Fig. 1A and B; Supplementary Tables 5–5.1). The survival benefit of GT persisted in fungal and nonfungal disease and in MDR, and interaction terms were not significant (Supplementary Tables 7–9; Supplementary Fig. 1). In the HSCT subgroup, the total of 6 individuals survived to 30 days regardless of GT allocation, but numbers were insufficient to allow rigorous statistical testing (Supplementary Table 2).
5. Sensitivity and validation analyses
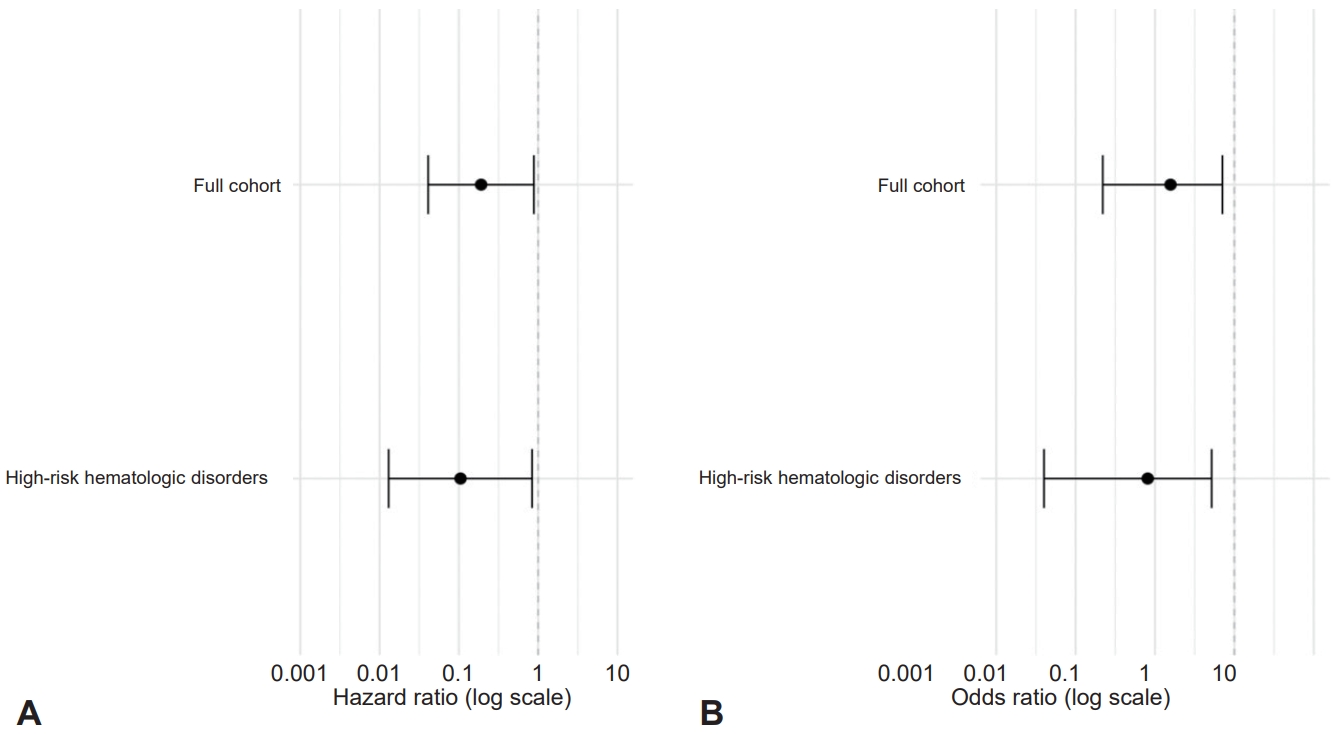
Multiple sensitivity analyses confirmed the strength of survival benefit of GT. A landmark analysis of 10 days demonstrated a significant trend in favor of GT but not significant at conventional levels of alpha (Supplementary Table 6; Supplementary Fig. 7), and no temporal bias was present between early and throughout subsequent treatment periods (Supplementary Fig. 2). Logistic regression adjusted for IPTW confirmed significant survival benefits for the entire cohort and for the high-risk subgroup, and E-value analysis demonstrated that vigorous unmeasured confounding would have to dominate to abolish the effect (Table 3; Supplementary Table 11; Supplementary Text 1). A doubly robust model of Cox regression using IPTW further established GT as an independent predictor of benefit for survival (Supplementary Table 12). Forest plots and receiver operating characteristic analysis demonstrated enduring benefit and resilient predictive performance (Fig. 2; Supplementary Fig. 8). Also, stratified analysis showed the benefit of GT persisted throughout and across neutropenia severity and by MDR status (Supplementary Table 10).
6. Secondary outcomes
1) 90-Day survival
The long-term survival analysis showed a consistent direction of benefit associated with GT. Although 90-day survival was not statistically significant in the multivariate logistic regression model adjusting for fungal infection, MDR infection, and baseline ANC (adjusted OR, 0.429; 95% CI, 0.129–1.424; P=0.167), the unadjusted Kaplan-Meier analysis demonstrated a significant survival advantage among GT recipients (76.9% vs. 50.0%, log rank P=0.035). This finding suggests that the survival benefit of GT may persist over time, albeit with reduced statistical power in the extended follow-up period. The consistent trend observed across both 30- and 90-day outcomes reinforces the potential long-term benefit of GT in selected high-risk pediatric patients (Table 3).
2) Clinical recovery outcomes
GT was associated with significantly faster clinical recovery compared with the control group. The median time to fever resolution was 9.5 (IQR, 5.75–19.0) days in the GT group versus 15.5 (IQR, 11.0–24.5) days in controls (P=0.003). Similarly, the median time to recovery from FN was shorter in the GT group (11.5 days; IQR, 8.0–19.5 days) compared with controls (19.5 days; IQR, 10.25–28.75 days) (P=0.050), and the median time to ANC recovery was 18 (IQR, 12.75–28.25) days in the GT group versus 23 (IQR, 15.25–46.5) days in controls (P=0.022) (Table 4).
These associations remained statistically significant in multivariate Cox regression analyses. GT was independently associated with faster fever resolution (adjusted HR, 2.24; 95% CI, 1.09–4.59; P=0.028), FN recovery (adjusted HR, 2.35; 95% CI, 1.17–4.73; P=0.017), and ANC recovery (adjusted HR, 2.10; 95% CI, 1.01–4.36; P=0.047) (Supplementary Table 20; Supplementary Fig. 9).
To evaluate the robustness of these findings to unmeasured confounding, E-values were calculated for each association. The point estimates ranged from 3.62 to 4.13, and the lower bounds of the confidence intervals ranged from 1.11 to 1.62 (Supplementary Table 21), suggesting that moderate unmeasured confounding would be required to explain away the observed effects. Kaplan-Meier curves for cumulative probabilities of clinical recovery are shown in Supplementary Fig. 10B–D.
3) Adverse events
GT was well tolerated across all 26 recipients. No SAEs were reported, including no instances of TRALI, hemolysis, anaphylaxis, or alloimmunization. One patient experienced transient fever during the infusion, which was attributed to ongoing infection rather than the transfusion itself. Among the 15 patients who were monitored for CMV reactivation, only one developed asymptomatic CMV viremia without evidence of organ involvement (6.7%). Minor adverse events such as chills or transient rashes were not systematically recorded but were not observed in any of the included cases. These findings support the overall safety profile of GT in this pediatric cohort (Supplementary Table 3).
4) Dose-response analysis
To evaluate whether higher doses of GT were associated with improved outcomes, we conducted a dose-response analysis stratified by total cell dose and weight-adjusted dose. Among GT recipients, 30-day survival was comparable between the low-dose group (≤0.173×10¹⁰ cells/kg) and the high-dose group (>0.173×10¹⁰ cells/kg), with survival rates of 92% and 91%, respectively (P=1.000). Similarly, when stratified by granulocyte dose per kilogram, no statistically significant differences in 30-day survival were observed (P=0.122) (Supplementary Table 22; Supplementary Figs. 11 and 12). These findings suggest that while GT is associated with improved survival, escalating the dose beyond standard thresholds did not yield additional benefit within this cohort.
Discussion
GT is reemerging as a promising adjunctive strategy for managing severe infections in neutropenic patients, especially in LMICs with increasing antimicrobial resistance and limited access to novel agents [24-26]. This 15-year cohort, the largest pediatric study in Southeast Asia, demonstrated that GT significantly improved 30-day survival and clinical recovery, supporting its role as a feasible adjunctive therapy in LMICs with limited treatment options. However, the observational design and small sample size of the study constrain the strength of causal inference. Although we used multivariable adjustment, PSM, and IPTW to attenuate confounding, residual biases—specifically, temporal and indication bias—remain impossible to exclude. Thus, the results must be interpreted cautiously and considered as hypothesisge-nerating, until confirmed in larger prospective cohorts.
Our findings align with prior pediatric and adult studies demonstrating clinical benefit from GT [21,24,27-32], particularly in invasive fungal and MDR infections. Pediatric studies by Oztürkmen et al. [20] and Keerthivasagam et al. [29] reported survival advantages in GT recipients. Our study extends this evidence to a 15-year real-world LMIC setting and supports the feasibility of standardized GT implementation. The 30-day survival benefit of GT was consistently demonstrated to endure by different analytic models, including regression, propensity score–based and weighting models, and results were presented in detail in the Supplementary Materials. These consistent findings across complementary methods strengthen the validity of the observed association between GT and improved short-term survival.
In addition to improved survival, GT was associated with faster resolution of fever, shorter duration of FN, and significantly earlier ANC recovery (P=0.047). Although this finding suggests enhanced recovery kinetics, the short lifespan of transfused granulocytes makes a direct effect on hematopoietic regeneration unlikely [33,34]. Rather, these outcomes support the mechanism of GT functioning as a transient innate immune bridge that facilitates early pathogen clearance. Transfused granulocytes exert their effects through phagocytosis, degranulation, the generation of reactive oxygen species and enhanced microbial killing by opsonization [21,27]. This immediate but short-lived immune augmentation likely allows sufficient time for endogenous marrow recovery, particularly in patients with profound or prolonged neutropenia. Therefore, the clinical benefit of GT is best explained by enhanced infection control rather than direct stimulation of hematopoiesis [21,27,35].
Subgroup analysis showed an overall favorable direction of effect for the majority of clinical and infection-based groups, but not all results reached statistical significance (Supplementary Tables 4–9). For example, the interactions between GT and fungal infections or MDR pathogens were not statistically significant (Supplementary Table 8). These results should be interpreted with caution, and further studies with larger cohorts are warranted. However, these results suggest that GT’s benefit extends across pathogen types, supporting its use in LMIC settings facing antimicrobial resistance.
The cumulative GT dose was not significantly associated with 30-day survival, consistent with prior findings that emphasize clinical timing, host condition, and infection control over absolute granulocyte quantity [22,30]. The use and dose of G-CSF were comparable between groups, and multivariable models confirmed that the survival benefit was independent of G-CSF exposure. No interaction was detected between the GT and G-CSF intensity. Among HSCT recipients, 100% survived at 30 days, likely reflecting posttransplant supportive care rather than the GT effect. Exploratory analysis of GT timing revealed higher mortality in patients receiving GT within 4 to 7 days after febrile onset, potentially reflecting indication bias in critically ill patients selected for early intervention.
We also investigated whether GT dose was correlated with 30-day survival outcomes. As indicated by Supplementary Table 22 and Supplementary Figs. 11 and 12, when stratified by total dose or dose per kilogram, no obvious dose-response relationship was identified. These data indicate the standard dosing regimen could be adequate; the dose-dependent effects need to be assessed more definitively, and for that, studies with larger numbers are required.
GT was well tolerated. No severe transfusion-related adverse events, including TRALI, anaphylaxis, or hemolysis, were observed. Only 1 case of CMV reactivation occurred, without organ involvement. These safety data support the feasibility of GT when performed under standardized protocols with appropriate donor screening and monitoring, which is especially important in LMICs where resource allocation must balance benefit and risk.
Although the GT and control patients were treated during different periods, sensitivity analysis comparing the 2018–2022 versus 2022–2023 recipients of GT demonstrated no significant difference for 30-day survival (Supplementary Fig. 2). We performed a 10-day landmark analysis (Supplementary Table 6) as a correction for immortal time bias, which demonstrated a persistent trend benefit for GT. However, the risk for residual time-related confounding is recognized as a methodologic limitation inherent to the retrospective design.
This single-center retrospective study is limited by sample size. However, strengths include a 15-year real-world cohort, consistent protocols, consecutive inclusion, and robust confounder adjustment using multivariate models, IPTW, and PSM. These findings support the implementation of GT in pediatric LMIC settings. Future multicenter trials should refine donor mobilization, transfusion timing, and patient selection. Long-term follow-up, resistance surveillance, and cost-effectiveness analysis will be essential to establish GT as a validated adjunctive therapy for severe neutropenic infections.
 PDF Links
 PubReader
 ePub Link
 PubMed
 Download Citation


