


Introduction
Approximately 1%-5% of newborns in the neonatal intensive care unit suffer from necrotizing enterocolitis (NEC). This disease has a high mortality rate of 20%-40%; thus, it is considered one of the serious diseases in premature infant. It is an acute and severe disease that affects the digestive system of newborns1). The early symptoms of NEC are very similar to other related diseases and it is difficult to distinguish this disease from other digestive diseases or sepsis. For those reasons, only limited diagnosis can be made when only a blood test and physical examination are performed. To improve this situation, various studies related to neonatal NEC have been carried out. One of these studies indicated that calprotectin could be useful as an indicator for distinguishing NEC from other diseases in neonates1,2).
Calprotectin is a protein that is synthesized by the combination of 36-kDa calcium and iron. It accounts for 60% of soluble protein in human neutrophils and can be found in monocytes, macrophages, and epithelial cells1). Additionally, its structure is very stable because it contains calcium, and due to the high level of calcium in the intestine, the stable form of calprotectin can be maintained in the feces for about 7 days3,4).
The level of calprotectin in the feces increases after treatment for colon cancer, rectal cancer, inflammatory bowel diseases, and bacterial gastroenteritis5,6,7,8). It also increases when nonsteroidal anti-inflammatory drugs are used9). In conditions with increased levels of calprotectin, e.g., when there is inflammation in the intestine, white blood cell migration occur more frequently9,10). As the concentration of calprotectin in feces reflects neutrophil movement into the small intestine, the concentration of fecal calprotectin is directly correlated to the severity of inflammation in the small intestine9,11). After 1994, it became possible to measure fecal calprotectin12). Only a small amount of feces is required to perform the examination, and the examination process became simpler3). Calprotectin has been suggested as a useful indicator for noninvasive examination to determine the severity of inflammation in the intestine13,14).
We attempted to determine how the gestational age affects the level of calprotectin in premature infants. We also studied how different types and methods of feeding related to the level of fecal calprotectin. Lastly, we compared the level of fecal calprotectin in newborns with NEC to that of newborns without NEC. In doing so, we attempted to determine whether the level of calprotectin in the feces could be used as an indicator for diagnosing NEC in Korea.
Materials and methods
The participants of this study were newborns in the Konyang University Hospital neonatal intensive care unit or newborn unit. All participants had gestational ages of <37 weeks. We collected stools from these newborns over two separate periods. The first collection was from February to April 2012 and the second was from May to June 2013. We collected stools from premature infants with early symptoms and signs of NEC and normal premature infants with parental consent. We excluded newborns with congenital anomaly of intestine, acute gastroenteritis, or milk allergy.
Stool specimens were collected using a commercial kit (Calprest; Eurospital, Trieste, Italy). Using this kit, specimens were collected within 3 hours. Specimens were mixed with a roller shaker for over 20 minutes and centrifuged at 3,000 rpm for 5 minutes. Then, the top layer of the centrifuged specimen was transferred to a microcentrifuge and stored at -20℃. The longest period of storage was 3 months. Next, a calprotectin enzyme-linked immunosorbent assay [ELISA] kit (Calprotectin ELISA kit, Eurospital, Trieste, Italy) was used to measure the concentration of calprotectin in the specimens.
The medical records were checked and we interviewed their mothers to obtain information about the mothers' medical records; birth method; gestational age; birth weight; the age of the newborn at stool collection; and method, amount, and type of feeding. The blood tests were performed on the same day as the stools collection or within 3 days before or after stool collection.
Clinical symptoms observed at stool collection, radiological finding, blood test, and other test results of newborns with NEC were also recorded. We determined the level of disease severity using the modified version of Bell's staging criteria.
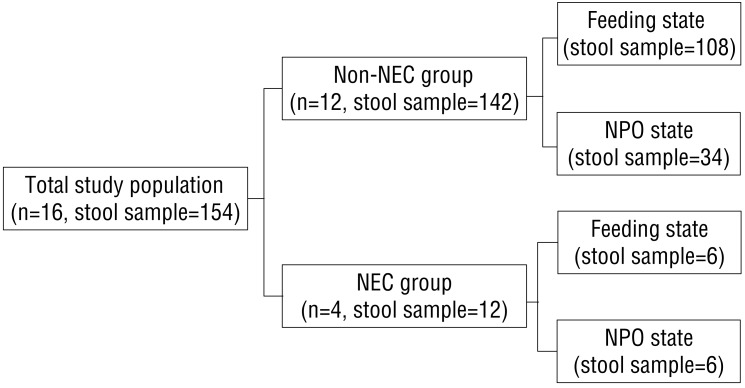
Total 154 stool samples were obtained from 16 premature infants. Twelve stool samples were obtained from 4 premature infants with NEC and 142 stool samples were obtained from 12 newborns without NEC (Fig. 1). The Modified Bell's stages were stage IA, IB, IIA, and IIB in 4 premature infants with NEC.
1. Statistical analyses
Statistical processing was carried out with SPSS ver. 10.0 (SPSS Inc., Chicago, IL, USA). The Mann-Whitney U test, chi square analysis, and Fisher exact test were used to compare NEC newborns with the non-NEC group. Logistic regression was performed for data that displayed statistical significance. Pearson's correlation coefficient and Spearman's rho coefficient were used for correlation analysis. The Mann-Whitney U test and independent t test were used to compare calprotectin concentrations in the normal newborn group. A P<0.05 was considered significant.
2. Ethical issues
Before carrying out the study, we obtained approval following review by the Konyang University Hospital Medical Ethics Committee. The parents of the participants were briefed on the study and provided with explanations on how the gathered medical data could be used. We obtained parental consent before performing the study.
Results
1. Comparison of characteristics between premature infants with NEC and non-NEC group
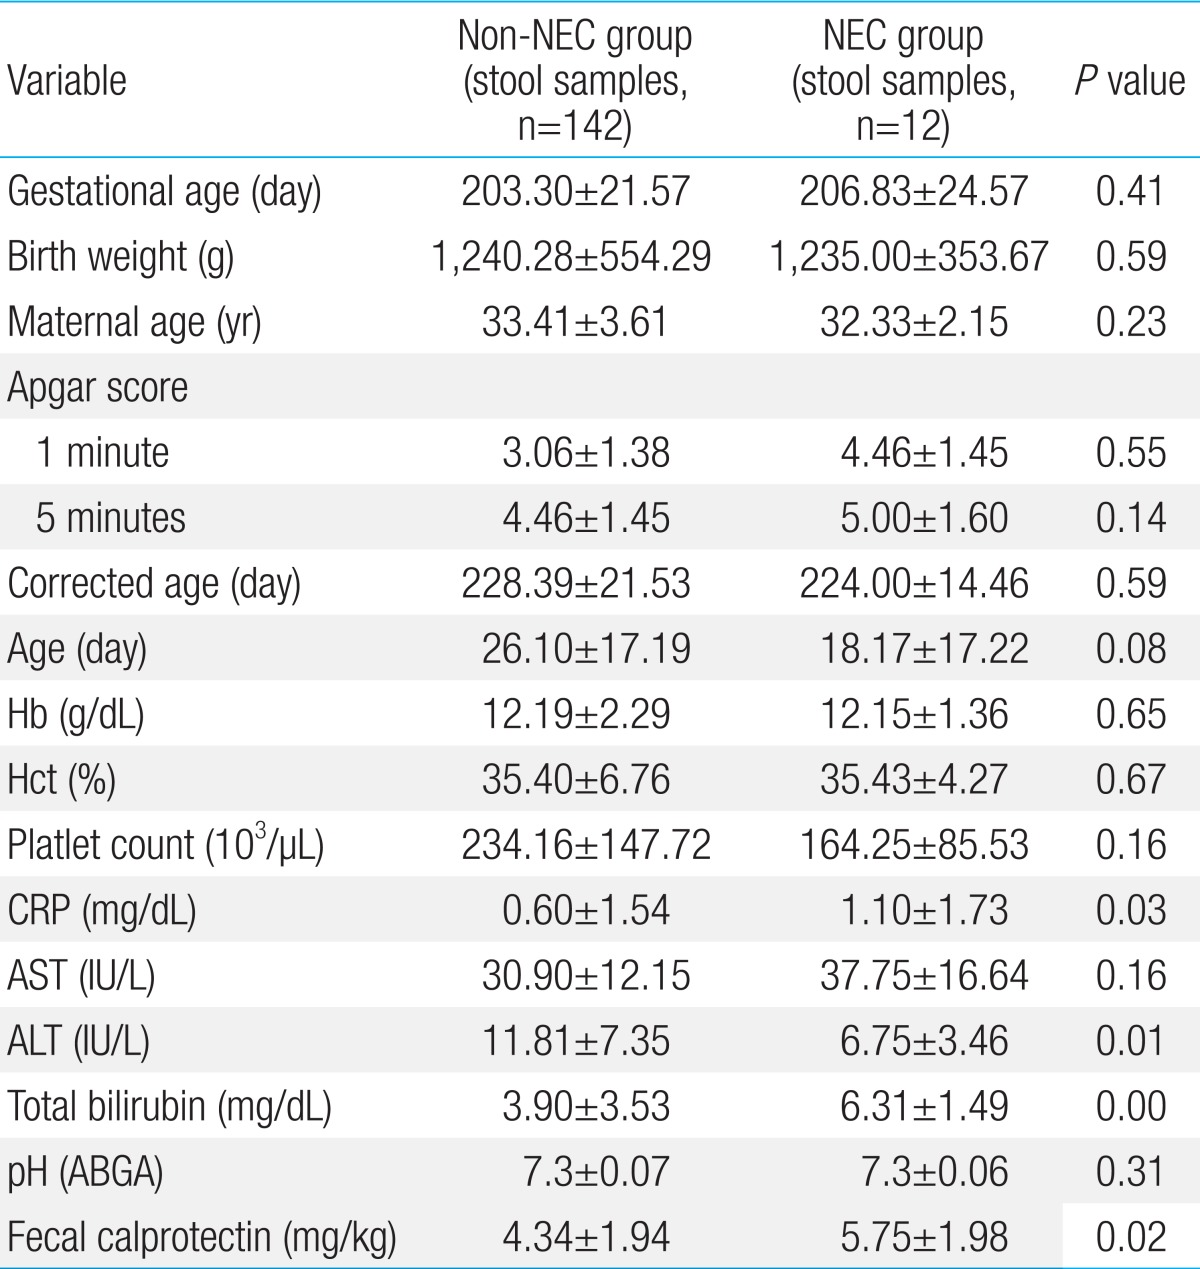
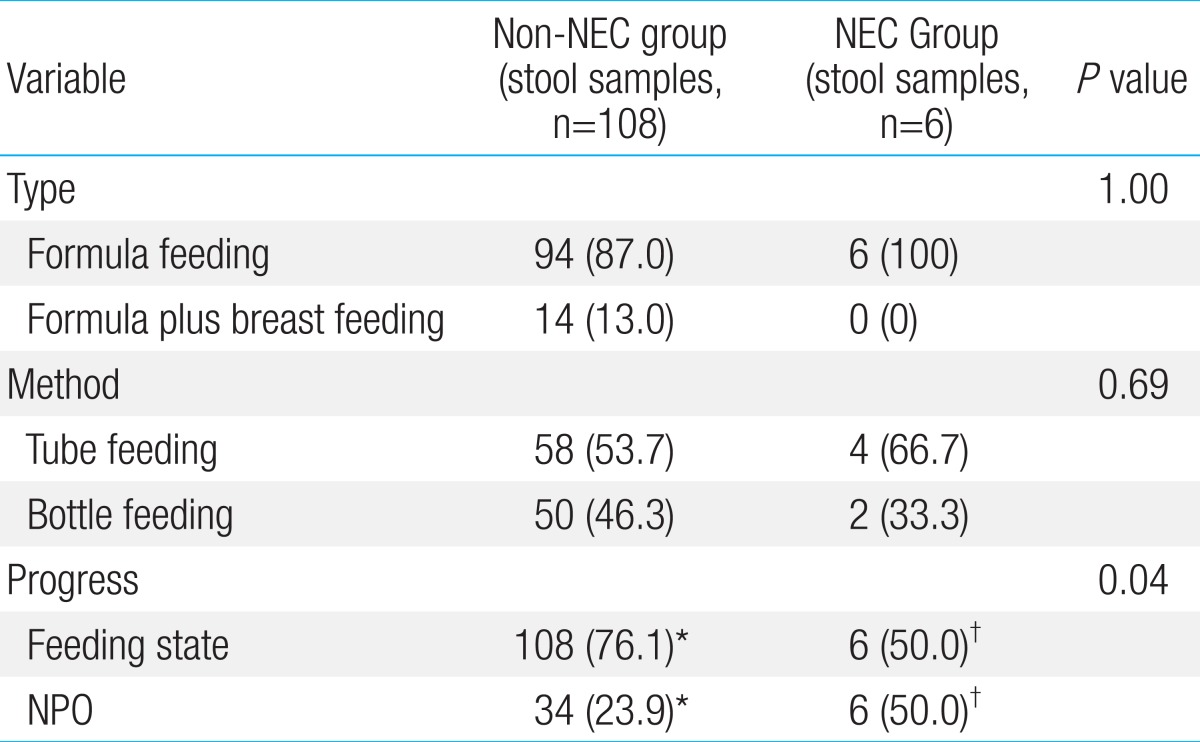
There were no significant differences in gestational age, birth weight, age of the mother, 1-minute Apgar score, 5-minute Apgar score, corrected age, age, white blood cell count, hemoglobin level, hematocrit level, aspartate aminotransferase (AST) level, platelet count, and metabolic acidosis. However, the NEC group had C-reactive protein (CRP) of 1.10±1.73 mg/dL, while the level in the control group was 0.60±1.54 mg/dL. The CRP level was significantly higher in the NEC group (P=0.03). The total bilirubin level was also significantly higher in the NEC group. The NEC group had a total bilirubin level of 6.31±1.49 mg/dL and the non-NEC group had a count of 3.90±3.53 mg/dL (P<0.001). The fecal calprotectin level was also higher in the NEC group (5.75±1.98 mg/dL) than in the non-NEC group (4.34±1.94 mg/kg) (P=0.02). The level of alanine aminotransferase (ALT) in the NEC group was 6.75±3.46 IU/L, and that in the non-NEC group was 11.81±7.35 IU/L (P=0.01). Even though the ALT level of the NEC group was lower than that of the non-NEC group, both values were within the normal range (Table 1). There was no significant difference in type and method of feeding between the two groups. However, the number of feedings was significantly higher in the non-NEC group (P=0.04). Nevertheless, this finding was expected because fasting is one of the treatments used for newborns with NEC (Table 2).
However, the logistic regression analysis of the variables that exhibited significant differences demonstrated that the levels of fecal calprotectin, CRP, ALT, and blood serum total bilirubin were not related to the presence or absence of NEC.
2. Effect of type, method of feeding and fasting on fecal calprotectin levels in non-NEC group
None of the participants was exclusively breast-fed. Ninety-four stool samples were obtained from newborns that were only formula-fed and 14 stool samples were obtained from newborns who were both breast- and formula-fed. The average fecal calprotectin concentrations were 4.34±1.89 mg/dL (only formula-fed) and 5.66±1.65 mg/dL (formula- and breast-fed). These data demonstrated that the concentration of fecal calprotectin was higher in newborns that were both formula- and breast-fed than only formula feeding newborn (P=0.01). Newborns that had been fed had higher fecal calprotectin concentrations than fasting newborns. The average fecal calprotectin concentration of fed newborns was 4.50±1.90 mg/dL; that of fasting newborns was 3.79±1.95 mg/dL. However, there was no statistical significance. There also was no significant difference in calprotectin concentrations between tube-fed and bottle-fed newborns.
3. Correlation between number of days since birth and fecal calprotectin level in non-NEC group
We collected 142 stool specimens from 12 newborns in the non-NEC group. Using these specimens, we analyzed the correlation between the number of days since birth and the fecal calprotectin level in the premature newborns without NEC. The coefficient for this study was -0.171, indicating statistical significance (P=0.04). However, when the coefficient values were interpreted, the 2 variables had a weak negative linear relationship, and when the data were presented using a scatter diagram, the 2 variables were not directly related. Thus, it was difficult to clarify the tendency of change in fecal calprotectin levels.
4. Correlation between stratified gestational age and fecal calprotectin level in non-NEC group
We grouped the non-NEC newborns according to gestational age. The first group included newborns with a gestational age <26 weeks; the second comprised newborns with a gestational age ≥26 weeks but <30 weeks. The third group comprised newborns with a gestational age ≥30 weeks but <33 weeks; the fourth comprised newborns with a gestational age >33 weeks. The correlation between gestational age and level of fecal calprotectin was analyzed based on these groupings. The first and second group had a Pearson coefficient of 0.45 (P=0.00) and -0.31 (P=0.03), respectively. This meant that there was a clear positive linear relationship between newborns born at <26 weeks gestational age (the first group) and fecal calprotectin level. There was a clear negative linear relationship for the second group (newborns with a gestational age ≥26 weeks but <30 weeks). The results of the first 2 groups were statistically significant (P=0.00 and P=0.03) (Fig. 2). There was no correlation between fecal calprotectin level and gestational age in the third and fourth groups (newborns with a gestational age ≥30 weeks).
Discussion
As stated earlier, NEC is fatal but occasionally affected disease in neonatal gastrointestinal system. As it can be fatal, many have expended much effort to discover an accurate means of diagnosing the disease at its earlier stages. Currently, NEC is diagnosed by combining clinical opinion, radiological finding, and the results of physical examination15). The severity of the disease is determined using Bell's staging criteria. However, there are no objective diagnostic criteria.
In 2010, Thuijls et al.2) compared the level of intestinal fatty acid protein, claudin-3, and calprotectin in newborns suspected of having NEC. Out of 35 subjects, 14 newborns that were actually diagnosed with NEC had higher levels of the 3 proteins. The high levels of intestinal fatty acid protein, claudin-3, and calprotectin observed in those newborns were statistically significant. In 2012, Reisinger et al.16) identified 62 newborns who were possible NEC patients and recorded their levels of urine and intestinal fatty acid protein, urine and serum amyloid A, and fecal calprotectin. They found that serum amyloid A did not contribute to improving diagnostic accuracy. Conversely, fecal calprotectin and urine fatty acid protein measured together demonstrated 94% sensitivity and 79% specificity, and contributed to increasing the accuracy of the NEC diagnosis.
The numerous previous studies17,18,19) that highlighted the usefulness of calprotectin as an indicator for diagnosing not only inflammatory bowel diseases in children and adults but also for diagnosing NEC in newborns inspired the present study. From this study, we confirmed that premature newborns with NEC have higher levels of fecal calprotectin than normal premature newborns. Previous studies have also yielded the same result. A preliminary study by Carroll et al.20) found that 7 newborns with NEC had clearly higher concentrations of calprotectin than the control group. In 2012, Aydemir et al.21) gathered data on 25 premature babies with the same birth weight and gestational age. As with previous studies, the newborns with NEC had higher levels of fecal calprotectin. Furthermore, when the standard uptake value of fecal calprotectin was set at 792 µg/g, the sensitivity was 76% and specificity was 92%.
The study in 2011 by Shulman et al.22) that involved 50 premature newborns also demonstrated no significant difference in calprotectin concentration. However, the study of Josefsson et al.23) yielded somewhat different results. Josefsson studied 57 babies with very low birth weight. How gestational age affected the level of fecal calprotectin was studied. He determined that the fecal calprotectin concentration decreased during the first week after birth but increased after the first week to the eighth week. The study by Rouge et al.24) in 2010, which involved 47 premature newborns, also verified the correlation between gestational age and fecal calprotectin levels. There was weak negative linear relationship in gestational age and calprotectin level with statistically significant. In addition, when we analyzed newborns according to stratified gestational age, there was a clear positive linear relationship between the 2 variables (gestational age and level of fecal calprotectin) in newborns born at <26 weeks gestational age. There was a distinctive negative linear relationship between the 2 variables in newborns born after or at week 26 to <30 weeks. As changes in fecal calprotectin level vary between studies, we believe that further research is required.
We also determined that there was a statistically significant difference in CRP levels between the NEC group and the non-NEC group. Though the difference was not large, suffice it to say a person with NEC also has an increased level of CRP25,26,27).
We studied how type and method of feeding and fasting affected the level of fecal calprotectin. None of the 3 variables had any effect on fecal calprotectin concentration. However, other studies have demonstrated the positive correlation between fecal calprotectin concentration and amount of feeding23,24).
The present study allowed us to evaluate the importance of fecal calprotectin concentration for diagnosing neonatal NEC. Nevertheless, it was difficult to compare the NEC group with the non-NEC group due to the small number of premature infants with NEC collected, and this was one of the limitations of this study. In addition, the majority of newborns with NEC assigned a level according to the modified version of Bell's staging criteria was deemed stage 1 or II. Due to this low stage scoring, a large difference in the fecal calprotectin level between the NEC group and the control group could not be observed. Lastly, none of the participants was solely breast-fed. Thus, it was impossible to compare the effect of breastfeeding and formula feeding on level of fecal calprotectin. Without these data, it also was not possible to compare the result with other studies that demonstrated the different effects of bottle feeding and breastfeeding on fecal calprotectin concentration18).
In conclusion, the present study determined that fecal calprotectin concentrations increase in newborns with NEC. If there were further studies on this topic, it would be possible to define a more objective and more accurate standard value that represents the fecal calprotectin concentration accordingly. Using this as a basis, the development of a better means of diagnosing NEC in newborns would aid in minimizing the mortality rate of such newborns in the neonatal intensive care unit.

 PDF Links
 PubReader
 PubMed
 Download Citation


