


Introduction
The term “small for gestational age” (SGA) refers to neonate who is smaller in size than normal neonates with the same gestational age. Impaired fetal growth has many causes, including fetal, placental, maternal, and environmental factors.1,2) Infants born SGA have a wide spectrum of clinical characteristics. SGA infants are at higher risk of perinatal morbidity, coronary heart disease, type 2 diabetes, and being short later in life.3,4)
The definition of SGA is confusedly used by neonatologist and endocrinologist. In some publications, SGA is defined as birth weight (BW) or length below 3rd percentile.5,6) In others, it is defined as below 10th percentile for gestational age.7,8) In practice, SGA is usually defined as BW below 10th percentile by neonatologists according to neonatal care guideline of Korea. However, endocrinologist defines SGA as BW or length below 3rd percentile or two standard deviations for a reference population due to health insurance standards for growth hormone therapy for those with short stature.9,10)
Catch-up growth of SGA infant is an early postnatal process. A common definition of catch-up growth is a growth that is over 10th percentile of normal Korean infant's growth curve.11) The majority of children who are born SGA experience catch-up growth by the age of 2.12,13) However, approximately 10% of children born SGA fail to show catch-up growth. They may remain short during childhood and after the age of 2.14,15) Thus, monitoring growth profile provides valuable information for children born SGA. Prompted identification of failed catch-up growth is important for management of these short children.
The aim of the study was to evaluate the difference in postnatal catch-up growth rate until the age of 2 between SGA groups with different definitions used by neonatologist and endocrinologist. Because of the variety of definitions of SGA, this study aimed to evaluate the catch-up growth rate of infant with BW between 3rd and 10th percentile for their gestational age. Perinatal factors related to catch-up growth in SGA infants were also evaluated in this study.
Materials and methods
1. Subjects
This was a retrospective study to determine longitudinal growth of SGA infants for a period of 2 years. Infants who were born with BW below 10th percentile and admitted to Korea University Anam Hospital and Ansan Hospital within 5 days of delivery were included in this study. The study population included SGA infants born between January 2011 to December 2014. We included children who came to the hospital at 6-month-old outpatient department (OPD) follow-up visit. We excluded children who had inadequate record of body profile and gestational age.
2. Study design and measures
Data on growth profile from 0 to 2 years were retrospectively acquired from chart review of hospital records. Height and weight of SGA children were recorded at 6, 12, and 24 months in OPD follow-up visits. Body profile was generally measured with standardized devices such as infantometer. Children's anthropometry was usually performed by a trained nurse. Medical history including gestational age, feeding regimen, and perinatal risk factors were taken from hospital files. Chronologic age was corrected for gestational age in preterm infants. Corrected age was calculated by subtracting the number of weeks born before 40 weeks gestation from the chronological age.
The total study population was divided into 2 groups (A and B) according to their BW. Group A consisted of infants born with BW below 3rd percentile while group B consisted of infants with BW between 3rd and 10th percentile for their gestational age. Growth data at 6, 12, and 24 months were then compared between the 2 groups to analyze their catch-up growth rate in height and weight. A subgroup analysis was performed to compare the catch-up growth rate in height and weight between term and preterm infants to evaluate the effect of gestational age.
Additionally, those who achieved catch-up growth at 6 and 24 months were compared to those who failed to show catch-up growth to identify perinatal factors related to successful catch-up growth. Perinatal factors analyzed in this study included gestational age, BW, very low BW (VLBW) status, Apgar score, sex, symmetry of SGA, twin, pregnancy induced hypertension (PIH), congenital infection, chromosome anomaly, chorioamnionitis, and oligohydramnios. Moreover, we analyzed the feeding method of children until the age of 6 months. In the present study, catch-up growth was defined as growth parameter over 10th percentile based on normal Korean infant's growth curve.
3. Statistical analysis
IBM SPSS Statistics ver. 20.0 (IBM Corp., Armonk, NY, USA) was used for all statistical analyses of collected hospital data. Comparison of baseline anthropometric and demographic variables between the 2 groups was performed using chi-square test or Fisher exact test for categorical variables and Student t test or Mann-Whitney test for continuous variables. P value below 0.05 was considered statistically significant.
Results
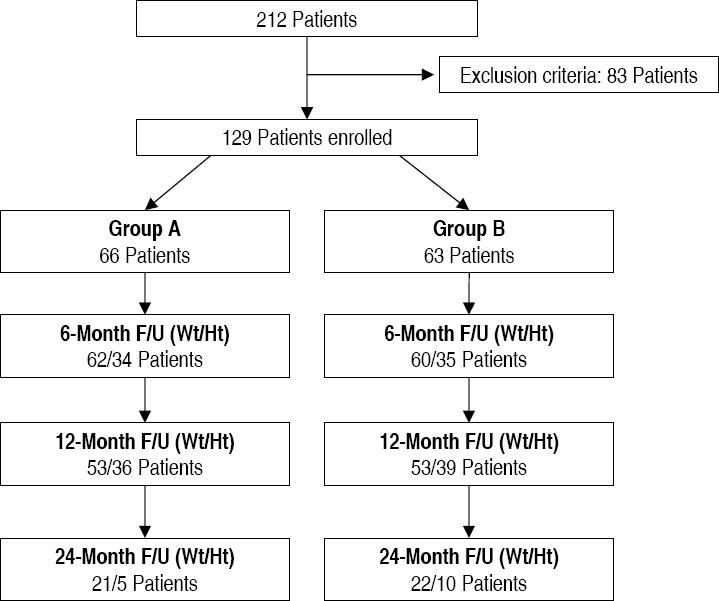
A total of 212 SGA infants were admitted at Korea University Anam Hospital and Ansan Hospital during the study period. Based on the exclusion criteria, a total of 83 patients were excluded. The remaining 129 SGA infants who met the inclusion criteria were enrolled for this study (Fig. 1). Of these infants, 60 were preterm infants while 69 were term infants. A total of 122 (94.5%), 106 (82.1 %), and 43 SGA infants (33.3%) were followed up at 6, 12, and 24 months, respectively, for weight.
1. Background characteristics
Of the total population of 129 infants, 66 were in group A and 63 were in group B (Fig. 1). Differences in perinatal characteristics between the 2 SGA groups are shown in Table 1. The mean gestational age was 37.4±1.7 weeks for group A and 35.9±3.0 weeks for group B (P<0.05). The proportion of premature infants was 25 (37.9 %) for group A and 35 (55.6%) for group B (P<0.05). Mean BW was 1,845±409 g for group A and 1,966±534 g for group B. The difference in mean BW between the 2 groups was not statistically significant. Perinatal characteristics for SGA including VLBW status, Apgar score, sex, twin, PIH, congenital infection, chromosome anomaly, chorioamnionitis, or oligohydramnios showed no statistically significant difference between the 2 groups. A total of 41 infants (62.1%) in group A and 11 infants (17.5%) in group B were symmetrical SGA (P<0.05).
2. Postnatal catch-up growth in the total population
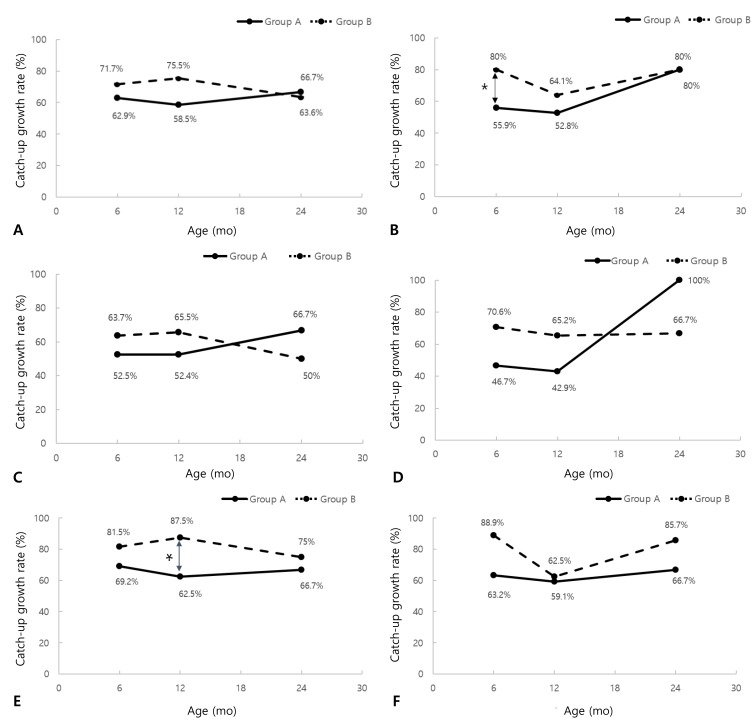
Regarding weight, at 6 months old (n=122), 62.9% in group A and 71.7% (P=0.303) in group B showed catch-up growth (Fig. 2A). At 12 months old (n=106), 58.5% in group A and 75.5% (P=0.062) in group B showed catch-up growth. At 24 months old (n=43), 66.7% in group A and 63.6% in group B showed catch-up growth in weight (P=0.835).
Regarding height, at 6 months old (n=69), 55.9% in group A and 80.0% (P<0.05) in group B showed catch-up growth (Fig. 2B). At 12 months old (n=75), 52.8% in group A and 64.1% in group B (P=0.320) showed catch-up growth. At 24 months old (n=15), 80.0% in group A and 80.0% in group B showed catch-up growth in height (P=1.000).
3. Postnatal catch-up growth in preterm population
Of the entire study group of 129 infants, there were 60 preterm infants. For weight, at 6 months old (n=56), 52.2% in group A and 63.6% (P=0.391) in group B showed catch-up growth (Fig. 2C). At 12 months old (n=50), 52.4% in group A and 65.5% (P=0.349) in group B showed catch-up growth. At 24 months old (n=16), 66.7% in group A and 50.0% (P=0.633) in group B showed catch-up growth in weight.
Regarding height, at 6 months old (n=32), 46.7% in group A and 70.6% (P=0.169) in group B showed catch-up growth (Fig. 2D). At 12 months old (n=37), 42.9% in group A and 65.2% (P=0.183) in group B showed catch-up growth. At 24 months old (n=5), 100% in group A and 66.7% (P=1.000) in group B showed catch-up growth in height.
4. Postnatal catch-up growth in term population
Of the entire study group of 129 infants, there were 69 term infants. With regard to weight, at 6 months old (n=66), 69.2% in group A and 81.5% (P=0.263) in group B showed catch-up growth (Fig. 2E). At 12 months old (n=56), 62.5% in group A and 87.5% (P<0.05) in group B showed catch-up growth. At 24 months old (n=27), 66.7% in group A and 75.0% (P=0.696) in group B showed catch-up growth in weight.
With regard to height, at 6 months old (n=37), 63.2% in group A and 88.9% (P=0.124) in group B showed catch-up growth (Fig. 2F). At 12 months old (n=38), 59.1% in group A and 62.5% (P=0.832) in group B showed catch-up growth. At 24 months old (n=10), 66.7 % in group A and 85.7% (P=1.000) in group B showed catch-up growth in height.
5. Perinatal factors related to successful catch-up growth
Perinatal characteristics of the catch-up group and the group failed to show catch-up for weight at 6 months old were not significantly different except for gestational age and BW (Table 2). The mean gestational age was 37.0±2.5 weeks for the catch-up group and 35.9±2.7 weeks for the group failed to show catch-up for weight (P<0.05). The mean BW was 1,990±460 g for the catch-up group and 1,719±451 g (P<0.05) for the group failed to show catch-up. At 24 months old, there was no significant difference in perinatal characteristics between the 2 groups for weight.
For catch-up growth of height at 6 months old, there was no significant difference between the 2 groups except for BW and the percentage of symmetrical SGA (Table 3). The mean BW was 1,997±429 g for the catch-up group and 1,616±438 g (P<0.05) for the group failed to show catch-up. The percentage of symmetrical SGA was 27.7% for the catch-up group and 68.2% (P<0.05) for the group failed to show catch-up. At 24 months old, there was no significant difference in perinatal characteristics between the 2 groups for height.
Discussion
Our study compared catch-up growth rate longitudinally for two years between the 2 SGA groups (group A, BW below 3rd percentile; group B, BW 3rd–10th percentile). At 24-month-old OPD follow-up visit, 66.7% and 80.0% in group A and 63.6% and 80.0% in group B showed catch-up growth for weight and height, respectively. A total of 20% of SGA infants in both groups did not show catch-up for height up to 2 years old.
The definition of catch-up growth was used variously in previous studies. Lim et al.16) have defined catch-up growth as those whose growth parameter is over 3rd percentile of normal Korean full term infant's growth curve. Ma et al.11) have defined catch-up growth as weight over the 10th percentile at 2 years of corrected age based on the Standard Korean Infant's Growth Curve. Likewise, growth failure has been defined as weight and height below the 10th percentile at 24 months using fetal growth charts in another study.17) We defined catch-up growth as growth parameter over 10th percentile of normal Korean infant's growth curve. Approximately 10%–25% of children born SGA fail to show catch-up growth and remain short as adults.18,19) This wide variation may be due to various definitions of SGA in different studies.
For both group A and B, catch-up growth was defined as growth parameter over 10th percentile of normal Korean infant's growth curve. It was expected that group A (BW below 3rd percentile) would have greater difficulty to achieve catch-up growth than group B (BW 3rd–10th percentile). However, significant difference in the rate of catch-up growth for height was only observed at 6-month-old OPD follow up visit in the present study. At 6-month-old follow-up and thereafter, there was no statistically significant difference in the rate of catch-up growth for height between the 2 groups.
Catch-up growth can be affected by environmental factors such as mode of postnatal diet. Lucas et al.20) have suggested that breastfeeding may promote faster growth in SGA infants due to specific nutrients in breastmilk, better nutrient absorption, and nonnutrient factors in milk. According to the study of Davies,21) there is no significant growth differences between term SGA infants fed either banked breast milk or formula with different protein contents. In the aspect of nutrition, we analyzed the mode of diet until the age of 6 months when babies are usually on liquid diet. With regard to feeding habit (breast milk, formula milk, or mixed) in our study, most infants were mixed-fed. The percentage of mixed-fed infants was 85.4% in the group that showed catch-up for weight at 6 months old and 85.0% in the group that failed to show catch-up. Such difference was not statistically significant between the 2 groups. The percentage of formula-fed infants was 13.4% in the catch-up group and 15% in the failed to catch-up group. The percentage of breastfed only infants was 1.2% in the successful group and 0% in the failed group.
In our study, difference in postnatal catch-up growth rate between the 2 groups showed mostly in the early period (≤6 months) of OPD follow-up visits. This result is in concordance with findings of other studies 21,22,23) which showed that catch-up occurs during the first 6 postnatal months. Postnatal catch-up growth at 24 months old OPD follow-up visit showed no statistically significant difference between the 2 SGA groups in our study (groups A and B: 80%). We reviewed the perinatal characteristics of the catch-up group and the group failed to show catch-up at 6 and 24 months for possible differences (Table 2). In regard of weight, at 6 months old, gestational age was 37.0±2.5 weeks for the catch-up group and 35.9±2.7 weeks for the failed to catch-up group (P<0.05). Preterm infants had more difficulty in gaining early postnatal catch-up growth of weight. At 6 months old, mean BW was 1,999±460 g for the catch-up group and 1,719±451 g for the failed to catch-up group (P<0.05). Infant born with lower BW had more difficulty in achieving early postnatal catch-up growth. At 24 months old, there was no significant difference in perinatal characteristics between the 2 groups.
Regular OPD follow-up visit is important for SGA infants to prevent consequences such as short stature, metabolic syndrome, and altered puberty. Catch-up is typically an early postnatal process that is completed by the age of 2 years in most SGA infants. If a short child who was born SGA shows no evidence of catch-up growth over 3 years of age, the child is less likely to catch up later on.1) These children should be referred to pediatric endocrinologist for interventions such as growth hormone therapy to achieve optimal growth acceleration. A child with metabolic disease or altered puberty should be referred to endocrinologist at an appropriate time through regular follow-up visits. Monthly follow-up until 3 months of age, quarterly follow-up until one year of age, and then biannually until age of 8 years are recommended as a follow-up plan for SGA infants.24)
The major strength of our study was its longitudinal approach for SGA children from birth. Moreover, there was no study of SGA comparing catch-up growth by different definitions of SGA in Korea. However, this study has some limitations. First, it was a retrospective study by collecting medical data of children based on hospital records. There was a decrease in the number of enrollment over time due to different OPD follow-up times. In addition, not all infants were included at each follow-up time. Secondly, we experienced OPD visit follow-up losses of children. It was another cause of small sample size as time passed by. Among infants who did not came to OPD follow-up visits until 2 years of age, 23 infants showed catch-up growth for 2 consecutive times until 12 months old. Furthermore, this study was based on data from only 2 institutions. No data were available after 2 years of age. Therefore, further prospective longitudinal study with information on catch-up growth of SGA children is needed to validate our findings.
In conclusion, there were no significant differences in postnatal catch-up growth rate until the age of 2 between the 2 SGA groups with different definitions except height at 6 months old. Low gestational age and BW was the risk factor for failed catch-up growth for weight at 6 months old compared to infants with catch-up growth. Regardless of SGA definition, approximately 20% of SGA children did not show catch-up in height until 2 years old. Our results suggest that a broader definition for SGA, such as infant with BW below 10th percentile for gestational age, would help us identify SGA infants with growth impairment earlier.
 PDF Links
 PubReader
 ePub Link
 PubMed
 Download Citation


