


Introduction
Lipid accumulation product (LAP) was first described as an alternative and powerful index for recognizing cardiovascular risk in adults [1]. In recent years, several studies supported the use of this index describing lipid overaccumulation, for the screening of metabolic syndrome (MetS) in healty population and different patient groups [2-6]. The LAP has also been associated with the presence and severity of nonalcoholic fatty liver disease (NAFLD) in adults which has been recognized as the liver manifestation of MetS [7].
In childhood, NAFLD is the major cause of chronic liver disease and its prevalence rises parallelly to obesity which becomes a common public health problem in the whole world. It includes a spectrum ranging from simple steatosis through nonalcoholic steatohepatitis to cirrhosis and end-stage liver disease; so early diagnosis and treatment are crucial like other comorbidities of obesity. Diagnostic procedures comprimise a combination of clinical parameters, laboratory and radiological findings. While only histology can distinguish simple steatosis or mild inflamatory changes from steatohepatosis, liver biopsy represents an invasive screening procedure [8]. More practical, noninvasive and less expensive methods are needed to diagnose NAFLD in childhood obesity. We aimed to evaluate the performance of LAP to predict NAFLD and its association with other metabolic parameters in children with obesity.
Methods
1. Patients
Eighty children (38 girls) aged between 6 and 18 years, diagnosed with obesity according to body mass index (BMI) ≥ 95th percentile for sex and age were included [9,10]. The patients who were receiving treatment leading to weight gain or loss, having an endocrinological disease or syndromic obesity were excluded.
2. Calculations
Sistolic/diastolic blood pressure (BP) values and Tanner stage were obtained from the medical records [11]. All of the measurements were taken by the same clinician. Height was measured using a stadiometer (Holtain Limited, Crymych, Wales) to the nearest 0.5 cm with the subject naked feet, eyes looking straight ahead, back against the wall. Weight was measured using an electronic scale (Medishop BY810, Zhongshan Beryl Electronics Co., Ltd, Zhongshan, China) sensitive to 100 g and BMI was calculated as weight in kilograms divided by the square of height in meters. The waist circumference (WC) was measured midway between the lowest rib and the superior border of iliac crest at the end of normal expiration, at a parallel level to the floor with a nonstretchable tape to the nearest 0.1 cm. The standard deviation score and percentiles were calculated according to Turkish children reference values previously reported [10,12]. Diastolic and systolic BP (mmHg) were measured with children in a sitting position, using a cuff appropriate for body size and an electronic manometer. The LAP was calculated as [WC (cm)–58]×triglyceride (TG) concentration (mmol/L) in girls; [WC (cm)–65]×TG concentration (mmol/L) in boys [1]. Other 2 variant LAP values were described as minLAP =[WC (cm)–3% value of WC according to age and sex] × TG concentration (mmol/L)] and as adjLAP=[WC (cm)–50% value of WC according to age and sex]×TG concentration (mmol/L) [12].
3. Biochemical and hormonal investigation
Biochemical and hormone levels routinely obtained at admission including fasting glucose/insulin, alanine aminotransferase (ALT), aspartate aminotransferase (AST), uric acid, total cholesterol (TC), high-density lipoprotein cholesterol (HDL-C), low-density lipoprotein cholesterol (LDL-C), and TG were recorded. Glucose was analyzed using the hexokinase method. TG, TC and HDL-C, uric acid, ALT, AST were assayed using the enzymatic colorimetric method and LDL-C level was calculated using the Friedewald formula. Serum insulin was measured according to the electrochemiluminescence immunoassay method. The homeostasis model assessment of insulin resistance (HOMA-IR) was calculated using the following formula: [fasting insulin (mIU/L)×fasting glucose (mg/dL)/405]. A HOMA-IR value greater than 3.16 was used to define insulin resistance [13]. The TC/HDL-C index was described as TC concentration (mg/dL)/HDL-cholesterol (HDL-C) (mg/dL) concentration [14].
4. Ultrasonography
The diagnosis of NAFLD was based on the presence of hepatic steatosis on liver ultrasonography that was not associated with acute or chronic liver diseases and the use of steatogenic medication [15]. Liver ultrasound examination was performed by an experienced radiologist, using a high-resolution B-mode ultrasound system Toshiba Aplio 500 (Tokyo, Japan) having 3.3- to 5-mHz conveks probe and 7.5- to 15-mHz lineer probe. The radiologist was blinded to all clinical and biochemical characteristics of subjects. NAFLD, if present, was classified based on the severity of fatty liver based on standard criteria. Patients were divided into 4 groups according to the degree of steatosis as follows, grade 0, absent; grade 1, mild; grade 2, moderate; and grade 3, advanced [16].
We divided the patients clinically into 3 groups according to ultrasound grading as follows, normal, grade 0; mild, grade 1; moderate-severe, grades 2–3.
5. Statistics
Descriptive statistics were presented as numbers and percentages for categorical variables, mean±standard deviation or median (interquartile range) for continuous variables depending on normal distribution. Chi-square test was used to compare ratios of sex and puberty stage according to NAFLD. To compare continuous variables according to NAFLD status, Student t test or Mann-Whitney test was used depending on parametric test assumptions. Spearman rank correlation coefficient was calculated for the relationships between LAP and puberty stage, fasting insulin, HOMA-IR, uric acid and TC/HDL-C. To determine the availability of LAP, adjLAP and minLAP variables in the diagnosis of hepatosteatosis, cutoff points were determined by receiver operating characteristic (ROC) analysis. Area under curve (AUC), cutoff point, sensitivity and specificity was calculated. To compare AUC in the ROC analysis MedCalc Version 18 (DEMO) (MedCalc Software bvba, Ostend, Belgium; http://www.medcalc.org; 2018) DeLong et al. (1988) program was used. Statistical analysis and calculations were performed IBM SPSS Statistics ver. 23.0 (IBM Co., Armonk, NY, USA). The statistical significance was set at P<0.05.
Results
Anthropometric measurements, biochemical values and indexes in patients with and without liver fat are summarized in the Table 1.
The LAP showed a positive and moderate correlation with puberty stage (rho=0.409; P<0.001), fasting insulin (rho=0.507; P<0.001), HOMA-IR (rho=0.470; P<0.001), uric acid (rho=0.522; P<0.001), TC/HDL-C (rho=0.494; P<0.001), and a weak negative correlation with HDL-C (rho=-3.833; P<0.001). Similar results were detected for minLAP and adjLAP (Table 2).
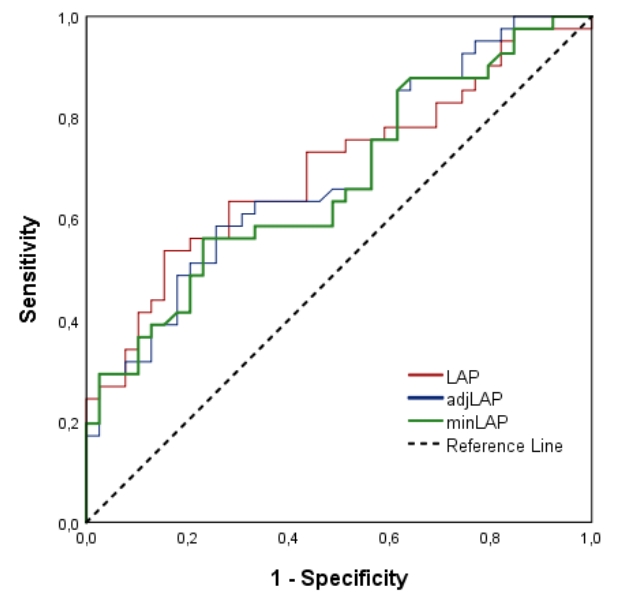
It was found that LAP values could be used to diagnose hepatosteatosis (AUC= 0.698; P=0.002). Sensitivity and specificity values for LAP≥42.70 cases were found as 53.7% and 84.6%, respectively (Fig. 1). The cutoff, sensitivity and specificity values of the indexes are summarized in the Table 3.
No difference between the AUC values of the 3 indexes was obtained (Table 4).
The medians and P values of the 3 indexes in the normal, mild and moderate-severe groups of patients with and without NAFLD are summarized in Table 5. When LAP, adjLAP, and minLAP values were compared according to NAFLD grade, significant differences were found in at least one group (P<0.05). As a result of binary comparisons; for LAP, the difference between normal and mild groups (P=0.035) and between normal and moderate-severe groups were statistically significant (P=0.037), but the difference between mild and moderate-severe groups was not statistically significant (P= 0.999). For adjLAP variable, the difference between normal and mild groups was significant (P=0.043). Differences between normal and moderate-severe groups (P=0.052) and mild and moderate-severe groups were not significant (P=0.999). Although there was a significant difference for minLAP in the general analysis, no significant difference was found in the pairwise comparisons with Bonferrroni correction (P>0.05).
Discussion
The main concerns about NAFLD are that its prevalence is rising worldwide and that it is the most common cause of chronic liver disease in childhood. The major cause of childhood NAFLD is obesity. The NAFLD should be suspected in overweight/obese children and adolescents if they consume drinks with high fructose content, if they have a strong family story and if their WC is above 95th percentile for age and sex [8]. The reference standard for confirming NAFLD is the liver histology; however it is an invasive procedure and demand a specialization. Recently, imaging by ultrasonography or magnetic resonance imaging with liver function tests and serum markers of liver fibrosis have been described as surrogate markers to estimate degree of steatosis, liver fibrosis and the risk of progression to end-stage liver disease as well [8].
The obesity and its complications such as NAFLD are important public health problems and also a source of economic burden. We consider that we need easier and less expensive methods for screening. The LAP was first introduced by Kahn [1] as an index of excessive lipid accumulation and suggested as a powerful tool to predict cardiovascular risk. Over the past years, presented studies revealed that it has also been a strong predictor of MetS and NAFLD in adults [2,3,7]. The WC and TG level are the 2 variables for calculating LAP [1]. A fasting lipid profile including TG level is recommended to all of the obese children even in the absence of risk factors and WC value can be easily obtained [9].
Dai et al. [7] have recently evaluated the accuracy of LAP for diagnosing NAFLD in general adult population. The identified cutoff values for LAP were 30.5 in men (sensitivity, 77%; specificity, 75%) and 23.0 (sensitivity, 82%; specificity, 79%) in women respectively. They have also marked that for both sexes the diagnostic accuracy for LAP had been significantly better in younger groups. In our study, we identified the cutoff value for LAP as 42.7 (sensitivity, 53.7%; specificity, 84.6%). The LAP, systolic BP, fasting insulin, ALT, uric acid and HOMA-IR values were significantly higher in our patients with NAFLD as they were in the study of Dai et al. [7]. We have also revealed a moderate positive correlation between LAP and fasting insulin level, HOMA-IR values and uric acid levels. In children, WC represents a practical athropometric parameter to identify central obesity and it may predict increased risk for insulin resistance and MetS [8,17-20]. It is also associated with increased hepatic fibrosis [8,17]. Most of the obese patients with NAFLD have higher frequency of hyperinsulinemia and insulin resistance which can be described by increased HOMA-IR values. Insulin resistance may cause abnormalities of lipid storage and lipolysis in insulin-sensitive tissues, which may induce increased fatty acid accumulation from adipose tissue to the liver and result in steatosis. It may also cause lipid peroxidation, which activates cytokins and inflammatory mediators and promotes the progression of steatosis to nonalcoholic steatohepatitis and liver fibrosis [19]. High levels of serum uric acid have been reported in children with MetS and it has been proposed as an independent predictor of NAFLD [8]. Uric acid exacerbates insulin resistance by suppressing nitric oxide bioavailability [21]. Conversely, hyperinsulinaemia contributes to hyperuricaemia by decreasing renal uric acid secretion and increasing the levels of uric acid-producing substrates. Uric acid may also involve inflammation and change the oxidative status of adipocytes which results in MetS [21]. Additively insulin resistance induced by elevated serum uric acid levels leads to hepatic lipid accumulation and activation of NADPH oxidase system-dependent oxidative stress as well as the concurrent inflammatory process induced by IL-6 and TNF-α which results in NAFLD [21]. Thus, we claim that LAP might also predict MetS and NAFLD within children as in adults.
Dai et al. [7] noticed that patients with NAFLD had also higher TG, TC and reduced HDL-C values for both sexes. We did not find any significant difference in lipid profile of patients with and without hepatosteatosis, but we showed a moderate positive correlation between LAP and TC/HDL-C and a weak negative correlation with HDL-C. In a previous study on pediatric overweight/obese population BMI, WC, HOMA-IR, and ALT levels have been found positively associated with higher risk of NAFLD while TG, TC, and LDL-C were similar in adolescents with and without NAFLD. Additively HDL-C has been reported lower in adolescent patients with moderate or severe NAFLD compared to those with mild NAFLD [18]. The lipid profile results of our patients with and without NAFLD are similar to those of Jain et al. [18] but in addition, we report here TC/HDL-C index values and its association with LAP. Nobili et al. [22] have recently shown significant positive correlation between NAFLD activity-fibrosis scores and TC/HDL ratio in obese children.
Lee and Jeong [17] have previously reported that WC and TG level increased significantly with hepatic steatosis severity, with higher values seen in the group with more severe disturbance. In our study, we have also determined that LAP was significantly higher in patients with more severe disease but none of the indexes could differentiate the patients with mild NAFLD from with moderate-severe disease. Thereby we can consider that LAP may help to detect NAFLD clinically but there is a limitation to distinguish patients with mild disease from those with more severe NAFLD. We consider that we need further investigations with larger cohorts.
We did not obtain any significant difference between the AUC values of LAP, minLAP and adjLAP. As LAP had the highest AUC value, we can easily suggest that there is no need for adjustment according to 50% and 3% of WC in patients between the ages of 6–18 years.
There are limitations to our study. First, we did not identify different cutoff values for LAP according to sex while a larger study group was needed. Secondly, as it was a retrospective study, we could not reach to BP values and laboratory findings in all of the patients. Thirdly, the presence of hepatic steatosis was based on ultrasonography findings rather than liver histology. However, the results of this study take attention to the availability of such indexes to predict complications and to reduce the economic loss caused by obesity.
In conclusion, LAP is an available, easy and inexpensive tool to predict NAFLD in children with obesity and it is correlated with fasting insulin, HOMA-IR, TC/HDL-C, and uric acid level. This is the first study assessing the accuracy of LAP in childhood obesity.
 PDF Links
 PubReader
 ePub Link
 PubMed
 Download Citation


