Article Contents
| Clin Exp Pediatr > Volume 67(7); 2024 |
|
Abstract
Footnotes
Funding
This research was supported by the National Research Foundation of Korea (NRF) grant funded by the Korea government (MSIT) (No. RS-2023-00253552) and by the BK21 FOUR (Fostering Outstanding Universities for Research) funded by the Ministry of Education and National Research Foundation of Korea (NRF-5199990614253).
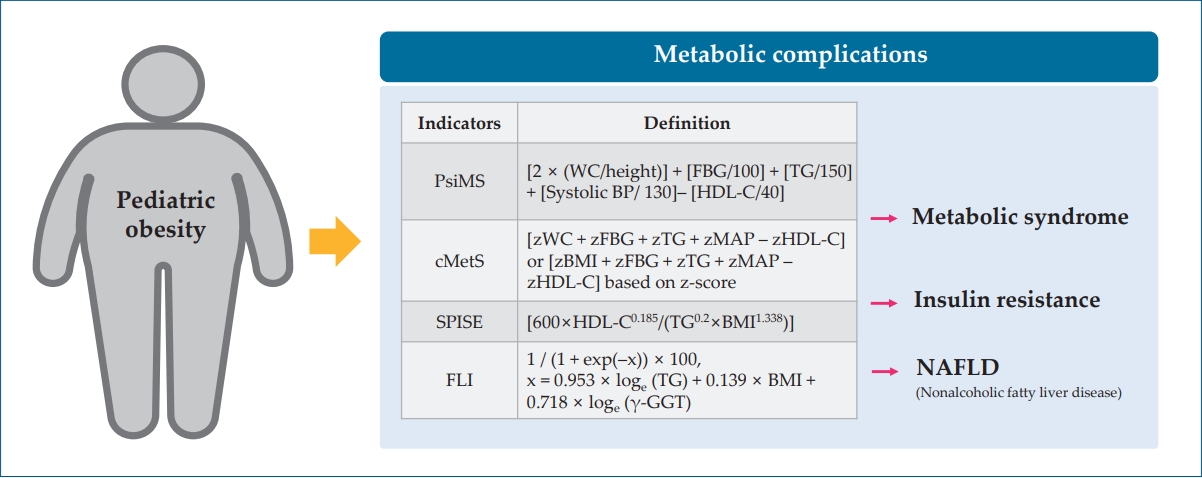
Table 1.
| Indicator | Definition or formula | Interpretation |
|---|---|---|
| Pediatric siMS (PsiMS) [28] | [2× (WC/height (cm))]+[FBG (mg/dL)/100]+[TG (mg/dL)/150]+[systolic BP (mmHg)/130]– [HDL-C (mg/dL)/40] | A higher PsiMS score indicates a higher risk of having MetS in children and adolescents. |
| Continuous metabolic syndrome score (cMetS) [29] | [zWC+zFBG+zTG+zMAP–zHDL-C] or [zBMI+zFBG+zTG+zMAP–zHDL-C] | A higher cMetS score indicates a higher risk of an unfavorable metabolic profile. |
| *The cMetS is calculated by standardizing the z-scores based on age and sex. | ||
| Single-point insulin sensitivity estimator (SPISE) [30] | [600×HDL-C0.185/(TG0.2×BMI1.338)] | The lower the SPISE, the higher the insulin resistance, indicating a higher risk of MetS and T2DM. |
| Fatty liver index (FLI) [31] | 1/(1+exp(–x))×100, x=0.953×loge (TG)+0.139×BMI+0.718×loge (γ-GGT) | FLI score below 30 rules out NAFLD, 30≤FLI<60 indicates an intermediate risk, and FLI ≥ 60 indicates a high risk of NAFLD |
| Hepatic steatosis index (HSI) [32] | 8×ALT/AST ratio+BMI (+2, if diabetes; +2, if female) | HSI >36.0 indicates a high risk of NAFLD |
siMS, simple metabolic syndrome score; WC, waist circumference; FBG, fasting blood glucose; TG, triglyceride; BP, blood pressure; HDL-C, high-density lipoprotein cholesterol; MetS, metabolic syndrome; MAP, mean arterial pressure; BMI, body mass index; T2DM, type 2 diabetes mellitus; γ-GGT, gamma-glutamyl transferase; NAFLD, nonalcoholic fatty liver disease; AST, aspartate aminotransferase; ALT, alanine aminotransferase.
Table 2.
| Study | Region, No. of study subjects, and range of age | Definition for sarcopenic obesity | Measures of sarcopenic obesity | Prevalence |
|---|---|---|---|---|
| McCarthy et al. [62] (2014) | UK, n=1,985, children aged 5–18.8 yr | 2SD lower than the mean MFR for the 3rd BMI quintile. | MFR | 8.3% and 15.5% in boys and girls of 5–10 yr, 9.7% and 5.7% in boys and girls of 10–18 yr |
| Kim K et al. [61] (2016) | Republic of Korea, n=1,919, children aged 10–18 yr | 1SD lower than the mean MFR for the 3rd BMI quintile. | Skeletal muscle-to-body fat ratio | 32.1% and 24.3% in boys and girls |
| Steffl et al. [63] (2017) | Czech Republic, n=730, children aged 4–14 yrs | 2SD lower than the mean MFR for the 3rd BMI quintile. | MFR | 7.2% and 9.3% in boys and girls |
| Moon et al. [64] (2018) | Republic of Korea, n=1,233, children aged 12–18 yr | Lower 10% of gender-specific ASM/ WT (%) (cutoff value of ASM/WT was 28.43% and 21.94% in boys and girls) and WHtR>0.47 | ASM/WT (%) | Total: 5.6% (32/571) |
| Gontarev et al. [51] (2020) | Macedonia, n=402, children aged 6–10 yr | 2SD lower than the mean MFR for the 3rd BMI quintile. | MFR | 9.2% and 5.9% in boys and girls |
| Park et al. [59] (2023) | Republic of Korea, n=227, children aged 7–9 yr | Criteria derived from the study by McCarthy et al. [61] | MFR | Total: 19.5%, Overweight: 84.4% |
| Gätjens et al. [65] (2021) | Germany, n=15,392, children aged 5–17 yr | FM/FFM-ratio (kg/kg) as defined by values exceeding the 90th percentile | FM/FFM-ratio (kg/kg) | 62.7% and 69.7% in overweight boys and girls |
| Sack et al. [66] (2022) | Germany, n=119, children aged 8–16 yr | Criteria derived from the study by McCarthy et al. [61] | MFR | 69.9% and 30.1% in boys and girls with obesity |
| Videira-Silva et al. [67] (2017) | Portugal, n=240, children aged 10–17 yr | ≤p25 for %SMM, based on reference charts for youth | SMM (kg)/ body WT*100 | 33.3% and 20.2% in overweight boys and girls |
| Pacifico et al. [56] (2020) | Italy, n=234, children aged 6–18 yr | The lowest tertile of RMM | RMM=100xmuscle mass (kg)/muscle mass (kg)+FM (kg) | 28.8% and 39.2% in overweight boys and girls |


 PDF Links
 PubReader
 ePub Link
 PubMed
 Download Citation


