Article Contents
| Clin Exp Pediatr > Volume 67(10); 2024 |
|
Abstract
This review examines the critical issues of declining total fertility rates (TFRs) and aging populations in East Asia with special focus on South Korea. It provides a comprehensive analysis of TFR trends, aging demographics, and the policy responses of these nations to the low-fertility crisis. This study highlights the intricate tapestry of the factors contributing to these demographic shifts, including economic, social, and cultural influences. It also examines the effectiveness of various prenatal policies implemented across these countries, offering insight into their successes and limitations. Furthermore, it explores the role of immigration as a potential solution to the structural challenges posed by low birth rates. This review underscores the importance of multifaceted strategies for addressing the complex demographic challenges faced by South Korea.
Graphical abstract. OECD, Organisation for Economic Co-operation and Development.
A diminishing total fertility rate (TFR), a signature trait of advancing nations, impacts demographic structures and future policy directions [1]. As a pivotal indicator, the TFR indicates the average number of children a woman is expected to bear in her lifetime, which has far-reaching consequences for societal evolution and economic strategies [2]. The inspection of demographic shifts over time has revealed a pronounced decline in the TFR since the mid-20th century. This trend became particularly noticeable after 1963, coinciding with the conclusion of the post-World War II baby boom. This decrease in birth rates has been recorded across a broad spectrum of developed regions. Notably, several nations within Asia, Europe, North America, Latin America, and the Caribbean have reported a declining TFR that consistently fell below the replacement level, reflecting a significant demographic transformation. By the end of this century, the TFR is expected to fall below the replacement level across the vast majority of nations worldwide (Fig. 1) [3,4].
This decline in the TFR can be attributed to a tapestry of factors such as increased economic opportunities that often lead women to delay motherhood in favor of career or education, the shift toward smaller family norms with urbanization, and expanded access to healthcare and family planning in developed nations. These elements, coupled with modernizing societal attitudes toward family size and robust welfare systems, underscore the trend toward smaller families [5-7]. For a nation to maintain its population size, a TFR of approximately 2.1 is generally considered necessary in most contexts. This figure is known as "replacement level fertility," meaning that a woman must bear 2 children to replace herself and her partner with a slight excess to account for the mortality rate of children and the fact that not all women will have children [8,9].
Table 1 shows the significant transformations in South Korea’s demographic landscape over the past few decades as evidenced by historical data trends [10,11]. Despite the low birth rates, the total population continued to increase, peaked in 2020 with 51,836,239 individuals, and began to decline thereafter. In stark contrast, the annual number of total live births peaked in 1970 with 1,006,645 births and declined thereafter. This decline is echoed in the crude birth rate (CBR), which peaked in 1960 at 38.6 births per 1,000 people, and in the TFR, which peaked at 6.33 children per woman in the same year. CBR and TFR showed sustained decreases, signaling a shift in reproductive behavior. Furthermore, the average age at first marriage has steadily increased, peaking at 31.3 years in 2022. This rise suggests a societal trend toward later marriages, potentially due to a variety of factors including increased educational and career opportunities for women, economic considerations, and changing societal norms. The confluence of these trends in declining birth rates and delayed marriages depicts a society experiencing profound social and economic evolution with potential implications for population dynamics, workforce composition, and social policy development in South Korea [12,13].
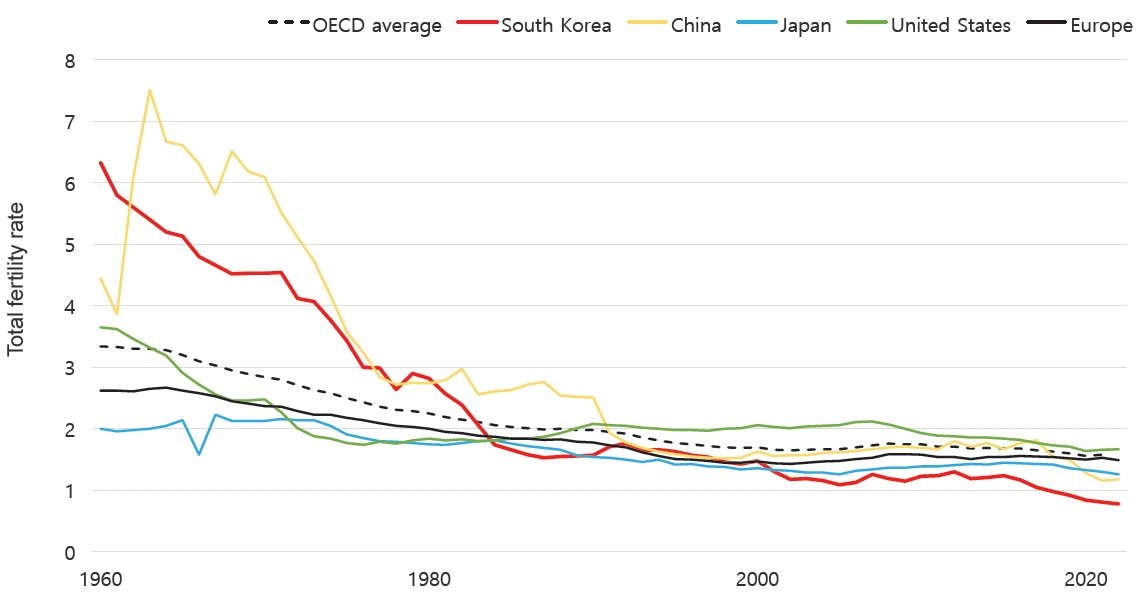
The TFR trends from 1960 onward present a multifaceted narrative of demographic changes across different regions (Fig. 2) [11,14]. South Korea, with the highest TFR among the entities assessed in 1960, witnessed the most substantial decrease over time, culminating in the steepest average decline per decade. This precipitous reduction will transition South Korea from its 1960 TFR zenith to its nadir in 2022. In contrast, China's TFR has fluctuated significantly, peaking in 1963, with the highest variability likely influenced by policy shifts, such as the one-child policy and its subsequent modifications, before experiencing a considerable drop by 2021 [15]. Although the TFR trends for the Organisation for Economic Co-operation and Development(OECD) averages for Japan and Europe varied in magnitude, they demonstrated a general declining trajectory. Among them, Japan's TFR demonstrated the smallest average decline per decade, indicating a more gradual demographic transition than its counterparts (Table 2). These varying TFR trajectories have significant implications for population dynamics, policy development, and economic planning in these regions, as they reflect the underlying shifts in societal norms, economic conditions, and governmental policies.
South Korea's demographic landscape has undergone significant changes, particularly with its population's rising median age. Historical data revealed a consistent increase in the median age, reflecting broader demographic shifts.In 1950, South Korea's median age was 17.6 years, comparatively lower than the global average of 22.2 years, Japan's 21.2 years, and the United States' 29.3 years. By 2010, South Korea's median age had surpassed that of the United States; it is projected to exceed Japan's median age by 2040. This remarkable increase culminated in a median age of 20.9 years by 1980, still lower than the global average of 21.5 years but rapidly approaching the median ages of Japan (31.6 years) and the United States (29.1 years) (Fig. 3) [11,16].
These changes in the median age signify South Korea's transition from a predominantly young population to an increasingly aging population, a trend mirroring the global pattern but at a notably faster rate. This accelerated aging process, influenced by factors such as very low birth rates and increased life expectancies [17], has transformed South Korea's demographic profile more swiftly than those of other advanced economies. This rapid demographic shift has profound implications for various societal aspects including workforce dynamics, economic growth, healthcare systems, and social policies. An aging population leads to higher dependency ratios, increased government spending on healthcare and pensions, and potential labor market challenges owing to a shrinking workforce. Additionally, aging can impact economic sectors, necessitate policy adjustments such as increasing retirement age, and require innovative approaches to addressing issues such as health equality and social isolation [18-21].
The global phenomenon of declining birth rates, a byproduct of industrialization, is most pronounced in East Asian nations, in which rapid urbanization and societal shifts have led to demographic crises. Nations such as South Korea, China, Japan, and Singapore face a pivotal juncture that grapples with the ramifications of precipitously low birth rates. These low rates pose significant challenges to the sustainability of social functioning and economic vitality. Exploring the low birth rate policies of Singapore, Japan, and China is the key to comprehending how these nations have addressed this crucial challenge.
In Singapore, a multifaceted approach to tackling low birth rates includes financial incentives such as increased baby bonus cash gifts, doubled paternity leave, childcare subsidies, and tax relief for working mothers [22,23]. Despite these efforts, the TFR fell to a historic low of 1.05 2022, reflecting the challenges in reversing this trend [14]. The government also addresses the rising childbearing age by providing subsidies for assisted reproductive technologies, although these efforts have not significantly offset the fertility decline among younger women [24]. Comprehensive childcare options and support for household work have also been provided. However, these efforts have not fully mitigated the high opportunity costs associated with childbearing. An emphasis on human capital investment has also led to a focus on child quality rather than quantity [25,26]. As part of this strategy, immigration has been used to moderate the impact of an aging population and low birth rates using a measured approach to granting citizenship and permanent residency [27]. This comprehensive strategy demonstrates Singapore's efforts to balance financial incentives, social support, and immigration to address the complex challenge of low birth rates.
Data from 2000 to 2022 show that Singapore will maintain a stable home ownership rate of approximately 90%, reflecting successful public housing policies and a steady housing market largely attributed to government efforts such as the Housing and Development Board [28]. However, during this period, the TFR decreased, indicating fewer children per woman, a common trend in many developed nations (Fig. 4) [29]. Reflecting on the situation in Singapore, we can discern that, although homeownership rates have been explored as a variable affecting TFR, the relationship between homeownership and birth rates unfolds in a complex and indirect manner. The TFR decline is the result of a confluence of factors, including economic conditions, housing affordability, social frameworks, and cultural norms. This complexity underscores the necessity to adopt a comprehensive approach to fully grasping how these diverse factors interact to shape the dynamics.
Japan has enacted a series of policies to combat its low birth rate, focusing on creating a better work–family balance. These measures included improved childcare services; incentives for paternal involvement in childcare; flexible working arrangements for parents; and enhanced facilities for housing, education, and healthcare [30]. Despite these efforts, including a parental leave policy that offers up to 14 months of leave and paid leave benefits, Japan experienced a significant decrease in its TFR, reaching a low equal to its previous record at 1.26 in 2022, marking a continuous decline over 7 years. This indicates that, while Japan has been proactive at implementing family-friendly policies, it has not significantly reversed the low birth rate trend, suggesting the need for further evaluation and potential policy adjustments. In 2023, Japan launched the New Dimension Measure, a comprehensive strategy aimed at reversing the declining birth rates. This multifaceted approach includes doubling child allowances, particularly for third-born children, and extending these benefits to high school students while removing income caps for eligibility.It also proposes extending social insurance coverage to cover maternity expenses and introducing a universally accessible daycare program regardless of parental employment status. Additionally, the plan enhances childcare leave benefits, allowing parents to receive full after-tax income for a specified period [31]. This initiative represents a significant increase in government expenditures for family support, aligning Japan with some of the highest spenders in the OECD. However, the effectiveness of such financial incentives at significantly boosting birth rates remains a subject of ongoing analysis and debate.
Over the past few decades, China's approach to population management has evolved significantly. Efforts initially focused on controlling population growth through the “later, longer, fewer” policy introduced in 1973, followed by the more stringent one-child policy in 1979. Subsequently, the government transitioned to a two-child policy in 2016 and three-child policy in 2021, adapting to the nation’s changing demographic needs [32-34]. These policy shifts aimed to address declining birth rates and an increasingly aging population. The maternity leave policy increased from 56 days in the 1980s to as long as 365 days, and the 1990s saw the introduction of paternity leave, although it varied regionally [35,36]. In 2021, a comprehensive pro-natalist policy framework was introduced that highlighted traditional values and the importance of childbearing to foster a new marriage and childbirth culture. Efforts have also been made to enhance accessibility to fertility treatment and improve maternal healthcare through a social insurance funding model. However, challenges persist, including regional policy disparities and ongoing demographic management issues such as low birth rates and traditional gender roles [37,38]. Childcare policies in China have evolved from focusing solely on vulnerable children to adopting a more inclusive and universal approach [39]. Despite these efforts,the TFR in 2022 remains low at 1.18 per woman, underscoring the persistent challenges of demographic management.
This situation necessitates a more family-focused approach to childcare policies that reflects the demographic challenges across East Asian nations and marks a significant shift in policy toward encouraging childbirth [40,41]. In East Asian nations, many parents spend a significant amount of time and financial resources ensuring that their children gain access to top universities and careers. This has led to high parenting costs, which causes many couples to choose to have only 1 or 2 children or, in some cases, not have children at all. The widespread phenomenon of “education fever,” or considerable parental investment in education, embodies a preference for “quality over quantity” and is key to understanding the low birth rates in East Asia [42].
The dataset spanning 1993–2022 permits a comprehensive longitudinal analysis of female population dynamics juxtaposed with TFR in South Korea (Fig.5) [43]. This period marked a critical phase in South Korea's demographic evolution characterized by significant shifts in the age composition of the female population, particularly in childbearing-age cohorts. A critical observation from these data is the gradual decline in the number of women within the primary reproductive age bracket (15–49 years), with a more pronounced decrease in the 25–39-year-old segment [44]. This subgroup is traditionally viewed as the most fertile, making it a key determinant of national birth rates. The decline in this demographic is particularly concerning as it signals a contraction in the pool of potential mothers, which inherently limits the capacity for any substantial increase in birth numbers. Simultaneously, the TFR within the same timeframe exhibits marginal fluctuations but maintains a trajectory well below the replacement level of 2.1. Despite an occasional increase, this persistent sub-replacement fertility rate is insufficient to counterbalance the dwindling childbearing population. The data indicate that even nominal increases in the TFR cannot effectively translate to a significant increase in total live births given the shrinking demographic base. Moreover, the diminishing numbers in the younger female segment (1–14 years old) signal the perpetuation of this demographic challenge. The forecasted continuation of this trend indicates further erosion of the childbearing population, exacerbating the complexities associated with increasing birth rates in future decades. This finding indicates that a myopic focus on TFR enhancement without addressing the underlying demographic shifts cannot reverse the declining trajectory of total live births. A multifaceted approach encompassing broader demographic rejuvenation coupled with targeted fertility-enhancing policies is pivotal to this demographic conundrum.
Based on the 2020 data, several countries renowned for their active immigration policies to address low birth rates have a significant number of foreign-born residents. The United States leads with approximately 50.6 million immigrants, accounting for 15.3% of its total population, followed by Germany with 15.8 million immigrants making up 18.8% of its population. Other countries with significant immigrant populations include Canada with 8.0 million (21.3% of its population), Australia with 7.7 million (30.1%), the United Kingdom with 9.4 million (13.8%), and Sweden, where immigrants constitute 19.8% of the population [45]. In South Korea, growing concerns about the difficulty of solving the structural problem of low birth rates internally have brought immigration into focus as a promising alternative.
Immigration policies are highlighted for their multiple advantages in addressing demographic and economic challenges. The increase in population due to immigration counters low birth rates and aging, contributing to a more balanced demographic structure [46,47]. This policy plays a crucial role in resolving labor shortages by filling gaps in sectors that are less favored by native-born citizens [48,49]. In addition, the influx of younger working immigrants supports the pension system, which is essential for sustaining a contributor base among an aging native population [50]. Immigrants’ diverse skills and contributions are vital across various sectors for enhancing economic sustainability [51]. The shift to a diverse, multicultural society may enrich the zasocial structure but can also present potential challenges. The significant influx of immigrants and refugees can lead to social integration issues, potentially resulting in cultural conflicts and social tensions [52]. Economically, the burden of supporting a large immigrant population includes costs related to housing, social security, education, and healthcare [53,54]. Labor market dynamics may also be affected, possibly leading to oversupply in certain sectors or undercutting wages, especially in lower-skilled fields [55]. Furthermore, political and social resistance, as evidenced by the rise of far-right groups opposing immigration, can lead to political instability and societal divisions [56]. The dependence on immigration for population growth may create long-term demographic imbalances, and an increasing immigrant population can strain public services and infrastructure, posing challenges to resource allocation and service delivery [57].
Individuals generally emigrate from less affluent to more prosperous nations in search of improved opportunities [58]. Several key factors must be considered for South Korea to emerge as a successful immigrant host, including developing a robust welfare system, fostering positive attitudes toward immigrants, and streamlining citizenship processes. Attracting skilled and qualified individuals requires creating an environment that adequately meets their needs and rights. The effectiveness of South Korea's immigration policy hinges on its ability to address these aspects and ensure the wellbeing and socioeconomic benefits of immigrants.
Financial support policies are crucial in the global fight against demographic decline, with Sweden and Hungary showing a significant impact of well-structured incentives on family planning decisions. Sweden’s introduction of a 9-month parental leave in the 1970s [59] and the "speed premium" policy in the 1980s [60] encouraged families to bear children closer in age, which contributes to an increase in the country’s TFR from about 1.6 in the early 1980s to above the replacement rate of 2.1 by the 1990s, a notable achievement against the backdrop of globally declining TFR (Fig. 6) [4]. Similarly, Hungary’s pro-natalist policies initiated in 2010, including the Family Housing Allowance, which aimed to provide significant financial incentives and support systems, increased its TFR from approximately 1.2 to approximately 1.6 [61,62]. These examples underline the efficacy of direct financial support, such as bonuses and tax benefits, alongside indirect mechanisms, such as subsidized childcare and housing benefits, that both offer financial relief and promote a societal ethos that values family growth. The experiences of Sweden and Hungary highlight the pivotal role of financial support policies in addressing demographic challenges, emphasizing the importance of inclusiveness in policy frameworks to foster conducive environments for family expansion.
However,the implementation of financial support policies, from concept to impact, is challenging. The variation in policy effectiveness across different socioeconomic landscapes underscores the complexity of applying such strategies universally. The primary challenge lies in crafting policies that are comprehensive and accessible to all population segments, addressing core issues such as the cost of living, housing availability, and work–life balance [63]. This necessitates a dynamic approach to policy formulation and implementation that responds to evolving societal and economic needs.
Financial incentives alone are significant may not drastically alter childbearing decisions. A comprehensive approach that includes readily available childcare, employer support, and sufficient living conditions is essential to a robust demographic strategy [64]. The persistence of traditional gender roles in which women are expected to prioritize domestic responsibilities and childcare continues to influence personal and familial decisions [65]. Addressing these societal norms and providing substantial support for work–life balance are crucial components of any successful demographic policy. Social support policies complement financial incentives by addressing noneconomic barriers to increasing birth rates. These include creating a supportive work environment for parents, ensuring accessible and affordable childcare, and promoting gender equality at home and in the workplace [66]. Such policies both support parents and help shift societal norms toward a more equitable sharing of parental responsibilities.
The increasing median age at first marriage in South Korea, which increased from 27.79 to 33.72 years for men and from 24.78 to 31.26 years for women from 1990 to 2022, significantly influences the TFR (Fig. 7) [10,67]. This upward trend, highlighting societal shifts toward prioritizing personal development, career, and financial stability, both reflects changing societal norms around marriage and contributes to lower fertility rates. As individuals marry and start families later,they face a reduced fertility window, which leads to fewer children [68,69]. This delay, indicative of broader lifestyle and career considerations, positions family planning as one of several life goals, challenging traditional norms and impacting demographic trends. The emphasis on personal and career achievements before settling down underscores the transformative societal perspective that values individual growth along with familial expansion.
In addition to these foundational strategies, the integration of educational and awareness programs plays a pivotal role in enhancing social support policies aimed to address low birth rates. By challenging and ultimately changing deep-rooted societal views, such programs encourage a more inclusive parenting approach in which both parents are equally recognized and supported in their parenting roles [70]. Furthermore, public awareness campaigns that highlight the benefits of work–life balance and the importance of paternal involvement in childcare contribute to a cultural shift toward valuing and supporting families more holistically [71]. These initiatives, when combined with practical support such as childcare and financial incentives, create a multifaceted approach that addresses both tangible and intangible barriers to increasing birth rates.
The rapid and drastic decline in South Korea’s birth rate coupled with its increasingly aging population poses multidimensional challenges that extend beyond the increased burden of supporting older adults and providing tax base reductions. This demographic shift threatens potential growth rates, as a smaller workforce and higher savings rates among the older population dampen consumption and investment, impacting the competitiveness of sectors such as manufacturing and export. To effectively address these issues, South Korea needs a holistic strategy that not involves innovative prenatal and immigration policies as well as societal and cultural shifts. These efforts include fostering family-friendly work environments, reducing child-rearing costs, and rethinking societal norms about family life. Despite comprehensive policies targeting pregnancy, childbirth, and sexual imbalances, the persistence of low birth rates underscores the complexity of this issue, suggesting the need to reassess policy-level approaches to the underlying socioeconomic and cultural factors that influence fertility trends.
Fig. 1.
Total fertility rate (TFR) for 6 regions and the world, 1960–2100. A general decline in the TFR has been noted across all regions from 1960 to the present, with a projected continued decline toward or below replacement levels throughout the 21st century.
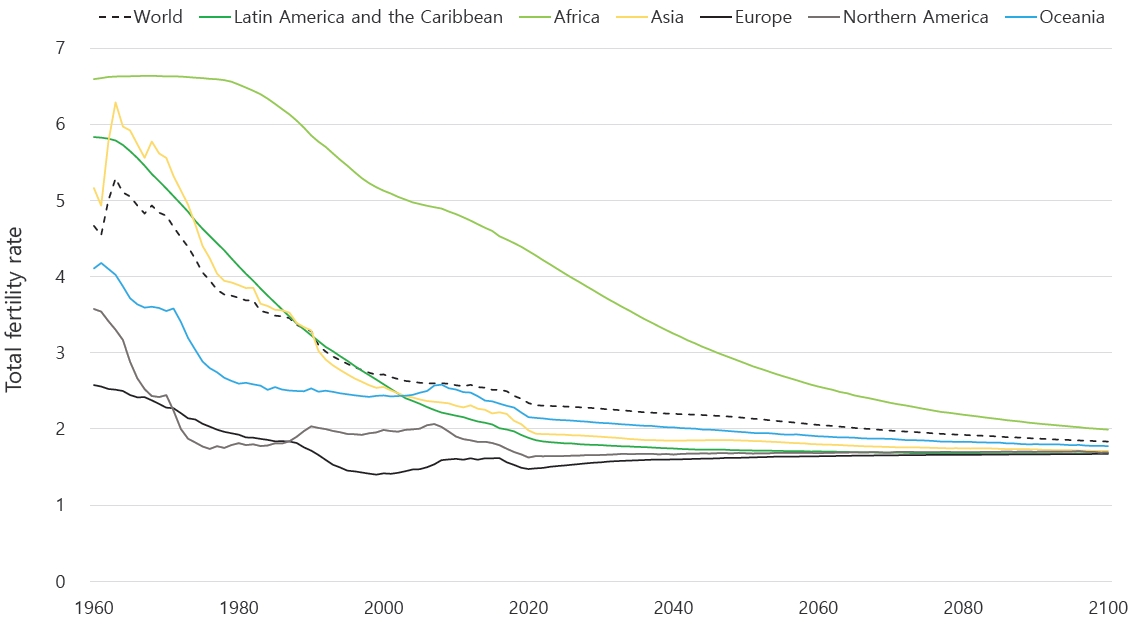
Fig. 2.
Total fertility rate (TFR) trends from 1960 onward for the Organisation for Economic Co-operation and Development (OECD) average for South Korea, China, Japan, the United States, and Europe. Each line represents the TFR trajectory of the entity over time.
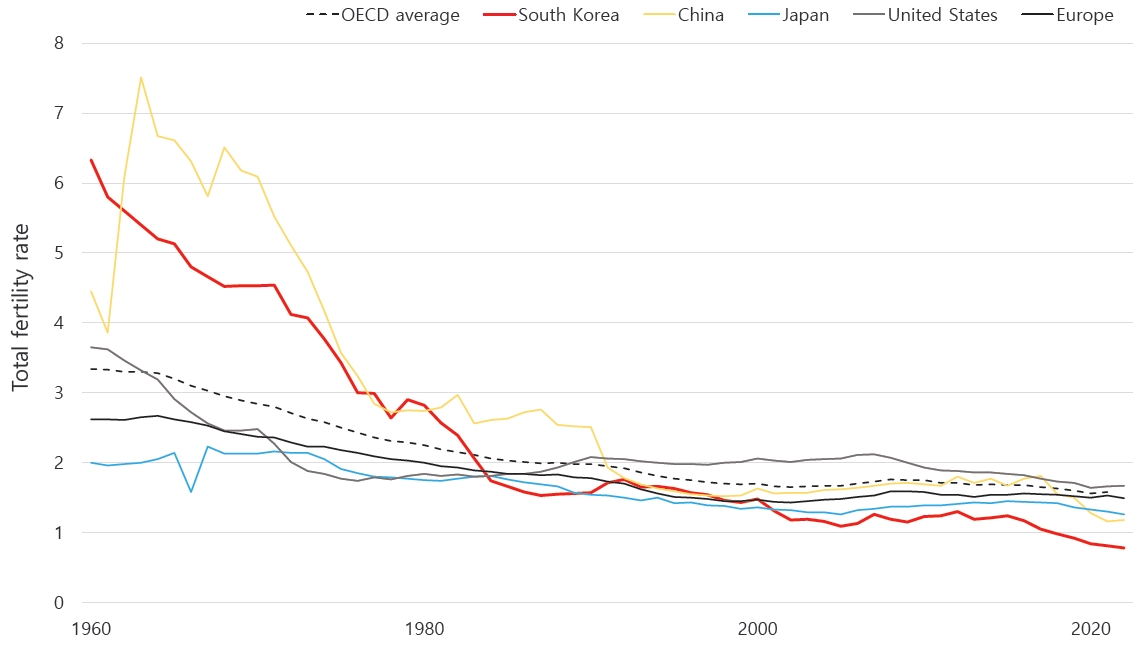
Fig. 3.
Median age trends, 1950–2060. This figure presents median age changes from 1950 to 2060, including historical data and future projections. It compares the global average with specific trends in South Korea, Japan, and the United States. The data illustrate significant demographic shifts and aging patterns, highlighting an increased median age over time in these regions.
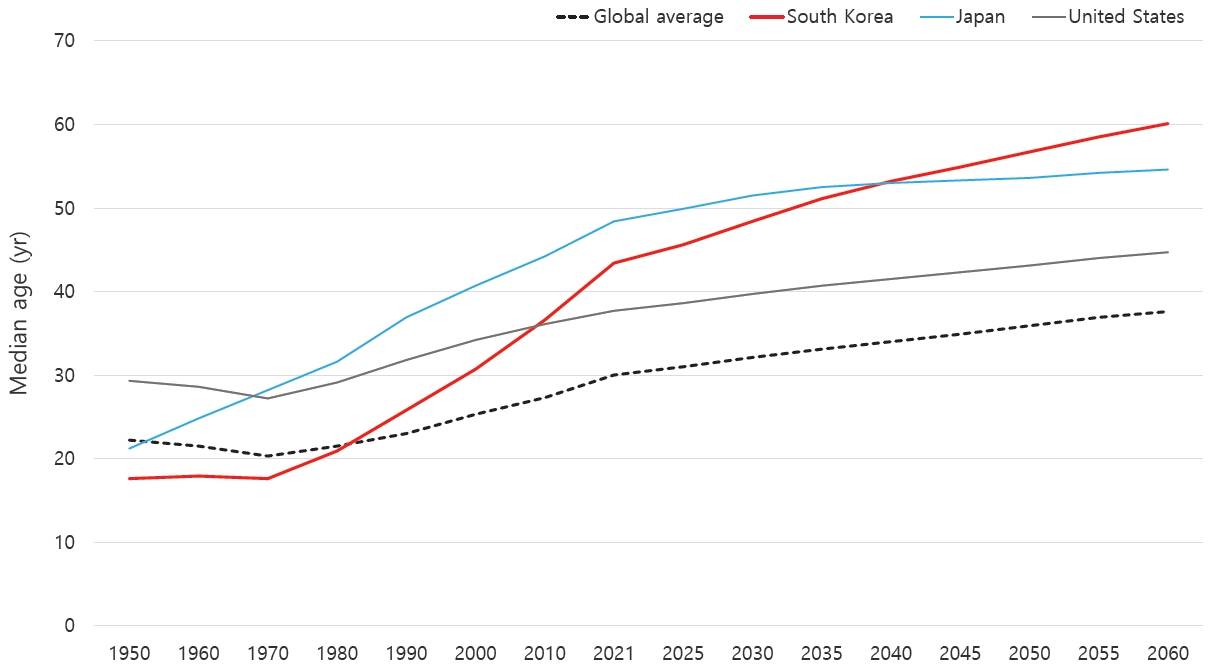
Fig. 4.
Trends in home ownership and total fertility rates (TFR) in Singapore (2000–2022). The homeownership rate is depicted by a series of bars indicating a consistently high level (approximately 90%). In contrast, the TFR exhibited a decreasing trend over the same period as illustrated by the line graph.
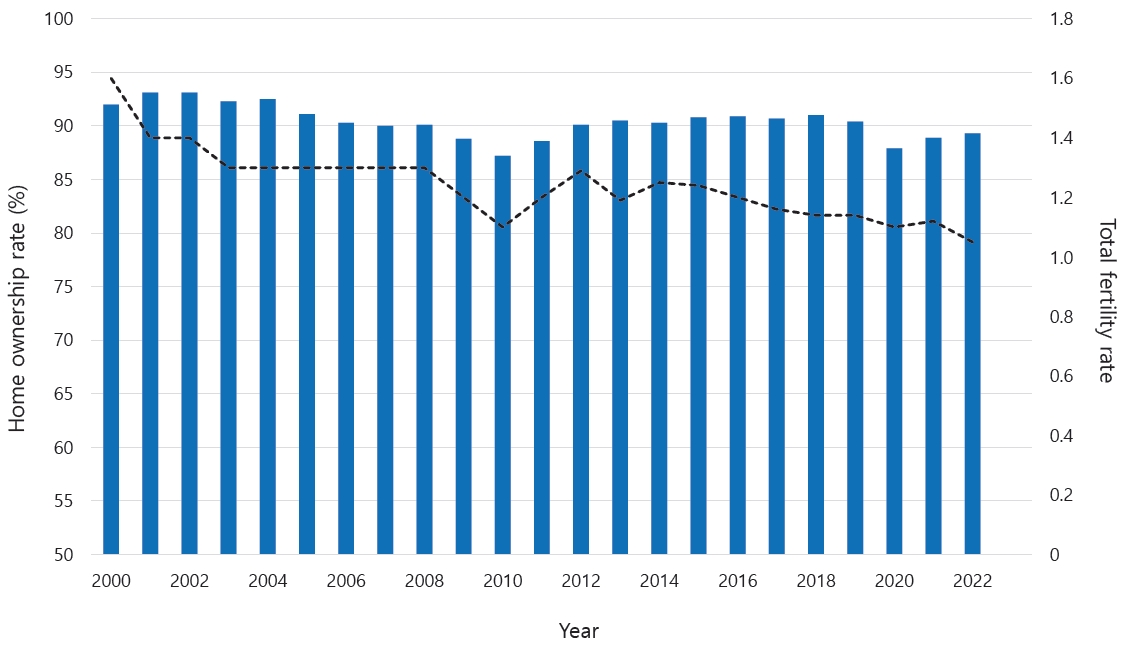
Fig. 5.
Trends in female population by age group and total fertility rate (TFR) in South Korea (1993–2022). This figure illustrates the demographic changes in the female population across different age groups in South Korea over a 29-year period alongside the annual TFR. The graph segments the female population into 4 key age groups: women aged 15–49 years (primary reproductive age), women aged 25–39 years (core childbearing age), girls aged 15–19 years (early reproductive age), and girls aged 1–14 years (future reproductive potential).
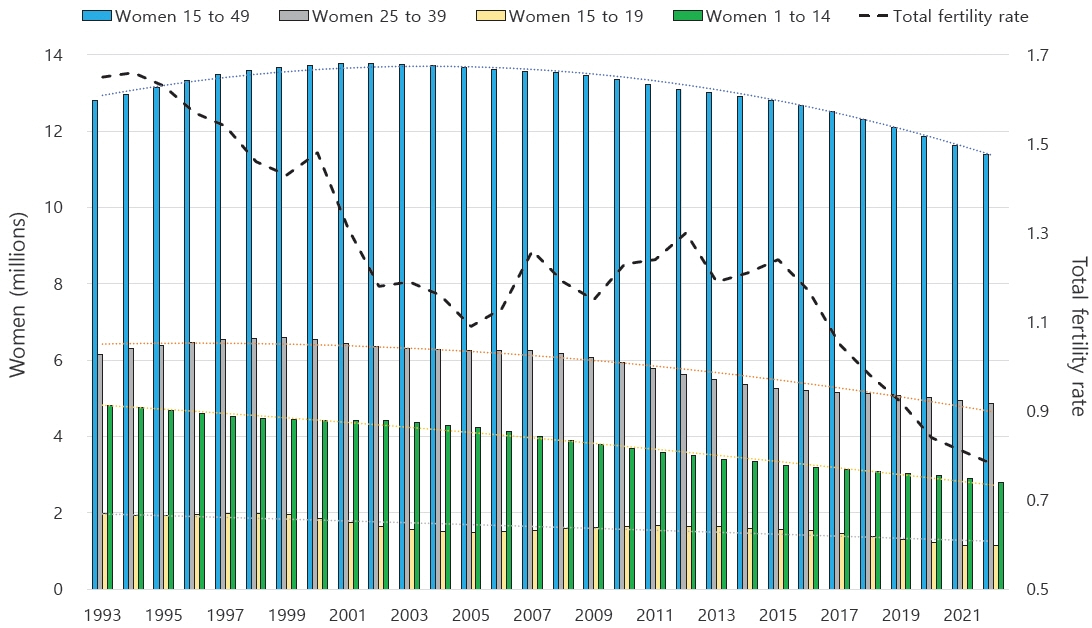
Fig. 6.
Trends in total fertility rates (TFR) in Sweden and Hungary (1960–2021). This figure presents a time-series analysis of the TFR in Sweden and Hungary over several decades. It highlights the introduction of the “speed premium” in Sweden and the initiation of pro-natalist policies in Hungary, with annotations indicating the approximate timing of these policy implementations.
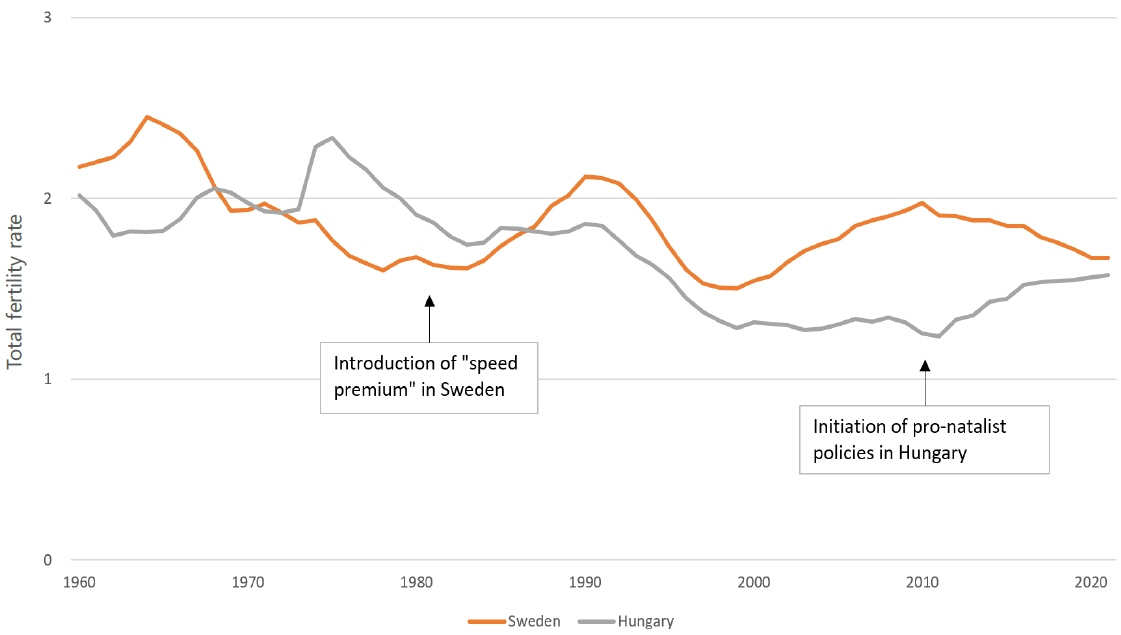
Fig. 7.
Median age at first marriage in South Korea by sex, 1990–2022. This figure illustrates the increasing trend in the median age at first marriage for both men and women in South Korea over the 33-year period from 1990 to 2022. In 1990, the median age at first marriage was approximately 27.79 years for men and 24.78 years for women. By 2022, these figures increased to 33.72 years for men and 31.26 years for women, reflecting societal changes and evolving attitudes toward marriage. These data highlight a continuous increase in the median age at first marriage for both sexes, indicating a shift in personal and societal priorities.
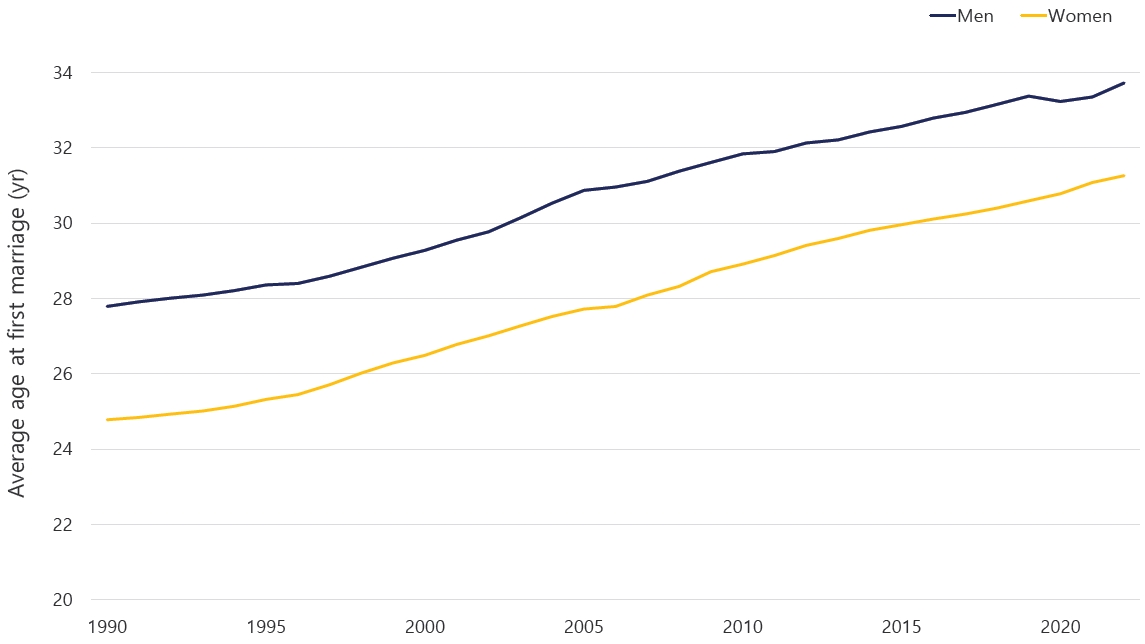
Table 1.
Total population, total live births, crude birth rate, total fertility rate, and average age at first marriage for women in South Korea (1960–2022)
Table 2.
Comparative summary of TFR changes: OECD average, South Korea, China, Japan, United States, and Europe
Table 3.
Comprehensive strategies to combat demographic decline
References
1. Cheng H, Luo W, Si S, Xin X, Peng Z, Zhou H, et al. Global trends in total fertility rate and its relation to national wealth, life expectancy and female education. BMC Public Health 2022;22:1346.


2. Feyrer J, Sacerdote B, Stern AD. Will the stork return to Europe and Japan? Understanding fertility within developed nations. J Econ Perspect 2008;22:3–22.


3. Vollset SE, Goren E, Yuan CW, Cao J, Smith AE, Hsiao T, et al. Fertility, mortality, migration, and population scenarios for 195 countries and territories from 2017 to 2100: a forecasting analysis for the Global Burden of Disease Study. Lancet 2020;396:1285–306.


4. United Nations, Department of Economic and Social Affairs, Population Division. Age-specific fertility rate (ASFR)[Internet]. New York, UN. [cited 2023 Nov 5]. Available from: https://population.un.org/wpp/Download/Standard/Fertility/.
5. Götmark F, Andersson M. Human fertility in relation to education, economy, religion, contraception, and family planning programs. BMC Public Health 2020;20:265.


6. Liu DH, Raftery AE. How do education and family planning accelerate fertility decline? Popul Dev Rev 2020;46:409–41.


7. Canning D, Schultz TP. The economic consequences of reproductive health and family planning. Lancet 2012;380:165–71.


8. Craig J. Replacement level fertility and future population growth. Popul Trends 1994;(78):20–2.
9. Smallwood S, Chamberlain J. Replacement fertility, what has it been and what does it mean? Popul Trends 2005;(119): 16–27.

10. Bae CW, Chung SH. Maternal and infant health statistics in Korea. Seoul (Korea): Medical Hub, 2018.
11. Korean Statistical Information Service. South Korea by population: total population, total fertility rate [Internet]. Daejeon (Korea), Statistics Korea. [cited 2023 Nov 5]. Available from: https://kosis.kr/visual/populationKorea/PopulationDashBoardMain.do;jsessionid=GQeBlBoirsls1vYjtV09GhXIcda7tJ7IN1aGP0Vjqb46Q5OynWPy4vuynxtKLteR.STAT_WAS2_servlet_engine4.
12. Raymo JM, Park H. Marriage decline in Korea: changing composition of the domestic marriage market and growth in international marriage. Demography 2020;57:171–94.


13. Park J, Lee K, Kim H. Factors associated with subsequent childbirth between marriage years in Korea. Int J Environ Res Public Health 2021;18:12560.


14. The World Bank. Fertility rate, total (births per woman) [Internet]. Washington, D.C.: The World Bank; c2024 [cited 2023 Nov 5]. Available from: https://data.worldbank.org/indicator/SP.DYN.TFRT.IN.
15. Lan M, Kuang Y. Evolutionary trends in fertility among Chinese women, 1990-2015. Reprod Health 2021;18:64.


16. OOSGA. Demographics of South Korea in 2023 - structure, labor, regional trends [Internet]. Singapore: OOSGA; c2018- 2024 [cited 2023 Nov 5]. Available from: https://oosga.com/demographics/kor/.
17. Lutz W, Sanderson W, Scherbov S. The coming acceleration of global population ageing. Nature 2008;451:716–9.


18. White MS, Burns C, Conlon HA. The impact of an aging population in the workplace. Workplace Health Saf 2018;66:493–8.


19. Temsumrit N. Can aging population affect economic growth through the channel of government spending? Heliyon 2023;9:e19521.


20. Cylus J, Al Tayara L. Health, an ageing labour force, and the economy: Does health moderate the relationship between population age-structure and economic growth? Soc Sci Med 2021;287:114353.


21. Tinker A. The social implications of an ageing population. Introduction. Mech Ageing Dev 2002;123:729–35.

22. Loke V, Sherraden M. Building assets from birth: Singapore’s policies. Asia Pac J Soc Work Dev 2019;29:19–26.

23. Chen M, Yip PSF, Yap MT. Identifying the most influential groups in determining Singapore's fertility. J Soc Policy 2017;47:139–60.

24. Blyth E, Lee GL. Can assisted reproductive technology (ART) impact Singapore's low fertility rate? Asian Popul Stud 2013;9:241–3.

26. Yeoh BS, Huang S. Foreign domestic workers and home-based care for elders in Singapore. J Aging Soc Policy 2010;22:69–88.


27. Zhan SW, Huang LL, Zhou M. Differentiation from above and below: evolving immigration policy and the integration dilemma in Singapore. Asian Pac Migr J 2022;31:3–25.


28. Glass MR, Salvador AE. Remaking Singapore's heartland: sustaining public housing through home and neighbourhood upgrade programmes. Eur J Housing Policy 2018;18:479–90.

29. Trading Economics. Singapore home ownership rate [Internet]. Singapore: Trading Economics; c2024 [cited 2023 Nov 15]. Available from: https://tradingeconomics.com/singapore/home-ownership-rate.
30. Boydell V, Mori R, Shahrook S, Gietel-Basten S. Low fertility and fertility policies in the Asia-Pacific region. Glob Health Med 2023;5:271–7.


31. Center for Strategic and International Studies.Can Japan’s ‘New Dimension’ measure reverse its low fertility rate? [Internet]. Washington, DC: Center for Strategic & International Studies; c2024 [cited 2023 Nov 15]. Available from: https://www.csis.org/analysis/can-japans-new-dimension-measure-reverse-itslow-fertility-rate.
32. Gietel-Basten S, Han X, Cheng Y. Assessing the impact of the "one-child policy" in China: a synthetic control approach. PLoS One 2019;14:e0220170.


33. Ning N, Tang J, Huang Y, Tan X, Lin Q, Sun M. Fertility intention to have a third child in China following the three-child policy: a cross-sectional study. Int J Environ Res Public Health 2022;19:15412.


34. Hong X, Jiang Y, Luo LF, Li PH. The impact of two-child policy on early education and development in China. Early Educ Dev 2022;33:369–74.

35. Liu H, Yu D, Wang H. A review of the development of maternity leave policy in China over the past 70 years. China Popul Dev Stud 2020;3:172–87.


36. Leng A, Kang F. Impact of two-child policy on female employment and corporate performance: empirical evidence from Chinese listed companies from 2010 to 2020. Humanit Soc Sci Commun 2022;9:451.


37. Zhou D, Gu X, Ding H. Impact of demographic transition on household energy consumption: a case from China. Energy Eng 2021;118:961–79.

38. Council on Foreign Relations. China steadily pivots towards promoting marriage and childbirth [Internet]. [cited 2023 Nov 15]. Available from: https://www.cfr.org/blog/china-steadilypivots-towards-promoting-marriage-and-childbirth.
39. Korea Institute of Child Care and Education. A Comparative study of low birth issues and childcare policy in East Asian Countries (Korea, China, Japan) (II) [Internet]. Seoul (Korea): Korea Institute of Child Care and Education; 2019 [cited 2023 Nov 15]. Available from: https://repo.kicce.re.kr/handle/2019.oak/1747.
40. Iijima S, Yokoyama K. Socioeconomic factors and policies regarding declining birth rates in Japan. Nihon Eiseigaku Zasshi 2018;73:305–12.


41. Jiang Y, Yang F. Motherhood health penalty: impact of fertility on physical and mental health of Chinese women of childbearing age. Front Public Health 2022;10:787844.


42. Anderson T, Kohler HP. Education fever and the East Asian fertility puzzle: a case study of low fertility in South Korea. Asian Popul Stud 2013;9:196–215.


43. Korean Statistical Information Service. Age-specific resident registration population [Internet]. Daejeon (Korea): Statistics Korea; 2024 [cited 2023 Nov 5]. Available from: https://kosis.kr/statHtml/statHtml.do?orgId=101&tblId=DT_1B040M1&conn_path=I2.
45. World Population Review. Immigration by country [Internet]. Lancaster (PA): World Population Review; 2024 [cited 2023 Nov 19]. Available from: https://worldpopulationreview.com/country-rankings/immigration-by-country.
46. Xia BS. The challenges of aging population: demographic development of labor force and immigration policy. Chinese J Urban Environ Stud 2016;4:1650016.

47. Bonin H, Raffelhüschen B, Walliser J. Can immigration alleviate the demographic burden. Finanzarchiv 2000;57:1–21.

48. Kerwin D, Warren R. US foreign-born workers in the global pandemic: essential and marginalized. J Migr Hum Secur 2020;8:282–300.


49. Liu-Farrer G, Green AE, Ozgen C, Cole MA. Immigration and labor shortages: learning from Japan and the United Kingdom. Asian Pac Migr J 2023;32:336–61.


50. Akin S. Immigration, fiscal policy, and welfare in an aging population. BE J Macroecon 2012;12:1–45.

51. Hagan J, Lowe N, Quingla C. Skills on the move: rethinking the relationship between human capital and immigrant economic mobility. Work Occup 2011;38:149–78.


52. Mihaylov G. Law in the process of social integration of immigrants. Int Conf Knowl Based Organ 2016;22:353–7.

53. Kaya A. Right-wing populism and Islamophobia in Europe and their impact on Turkey-EU relations. Turk Stud 2020;21:1–28.
54. Jarrett AA, Wyckoff S, Wilmore R. The impact of immigration on social security and medicare: a conceptual primer. J Comp Soc Welfare 1996;13:43–63.
55. Longhi S, Nijkamp P, Poot J. A meta-analytic assessment of the effect of immigration on wages. J Econ Surv 2005;19:451–77.

57. Center for Immigration Studies. Immigration, both legal and illegal, puts huge strain on the country [Internet]. Washington, DC: Center for Immigration Studies; [cited 2023 Nov 21]. Available from: https://cis.org/Report/Immigration-BothLegal-and-Illegal-Puts-Huge-Strain-Country.
58. Toma J. Determinants of international labour migration: theory and practice. In: Conference Proceedings EDAMBA 2015. Era of science diplomacy: implications for economics, business, management and related disciplines; 2015 Oct 21-23; Slovak Republic. University of Economics in Bratislava 2015:872-80.
59. Karita K, Kitada M. Political measures against declining birthrate-implication of good family policies and practice in Sweden or France. Nihon Eiseigaku Zasshi 2018;73:322–9.


60. Miranda V. Recent trends in birth intervals in Sweden: a decline of the speed-premium effect? Eur J Popul 2019;36:499–510.


61. Sági J, Lentner C. Certain aspects of family policy incentives for childbearing—a Hungarian study with an international outlook. Sustainability 2018;10:3976.

62. Cook LS, Iarskaia-Smirnova E, Kozlov VA. Trying to reverse demographic decline: pro-natalist and family policies in Russia, Poland and Hungary. Soc Policy Soc 2022;22:355–75.

63. Lee HJ, Park S, Lee W, Lee JE. A comparative analysis of policies against low fertility in foreign countries. Saengmyeong Yeon-gu 2022;65:97–127.

64. McLean C, Naumann I, Koslowski A. Access to childcare in Europe: parents' logistical challenges in cross-national perspective. Soc Policy Adm 2017;51:1367–85.


65. Thévenon O. Institutional settings of childbearing. In: Rondinelli C, Aassve A, Billari FC, editors. Reproductive decision-making in a macro-micro perspective. Dordrecht: Springer; 2014:17-39.
66. Hanappi D, Ryser VA, Bernardi L. The role of attitudes toward maternal employment in the relationship between job quality and fertility intentions. J Res Gend Stud 2016;6:192–219.
67. Korean Statistical Information Service. South Korea by Population: average age of first marriage [Internet]. Daejeon (Korea): Statistics Korea; [cited 2024 Feb 25]. Available from: https://kosis.kr/visual/populationKorea/PopulationDashBoardDetail.do.
68. Abdullah AS, Tey N, Mahpul IN, Azman NAA, Hamid RA. Correlates and consequences of delayed marriage in Malaysia. Int J Integr Eng 2021;13:1–10.

69. Cai ZL. Study on the delay of marriage and childbirth of Wenzhou Ouhai population and its influencing factors. J Innov Dev 2023;3:64–73.



 PDF Links
 PubReader
 ePub Link
 PubMed
 Download Citation


