Warning: fopen(/home/virtual/pediatrics/journal/upload/ip_log/ip_log_2024-04.txt) [function.fopen]: failed to open stream: Permission denied in /home/virtual/pediatrics/journal/ip_info/view_data.php on line 82

Warning: fwrite(): supplied argument is not a valid stream resource in /home/virtual/pediatrics/journal/ip_info/view_data.php on line 83
Prevalence of underweight and wasting in Iranian children aged below 5 years: a systematic review and meta-analysis

Volume 61(8); August

< Previous     Next >

Article Contents

Clin Exp Pediatr > Volume 61(8); 2018
Moradi, Shadmani, Mansori, Hanis, Khateri, and Mirzaei: Prevalence of underweight and wasting in Iranian children aged below 5 years: a systematic review and meta-analysis

Abstract

Purpose

Wasting and underweight are the 2 main indicators of children’s undernutrition. We aimed to estimate the prevalence of undernutrition at the national level in Iran.

Methods

We performed a search for original articles published in international and Iranian databases including MEDLINE, Web of Science, Google Scholar, Scopus, CINHAL (Cumulative Index to Nursing and Allied Health Literature), Scientific Information Database, Irandoc, Iranmedex, and Magiran during January 1989–August 2017. Seven keywords, in English and Persian, including malnutrition, protein energy malnutrition, growth disorders, underweight wasting, weight loss, children below 5 years old, and children, were used to search the databases.

Results

Finally, 17 articles were included in the meta-analysis, based on which the prevalence of underweight and wasting in Iranian children were estimated to be 11% and 5%, respectively. The prevalence rates of underweight among children in the central, western, southern, and northern parts of Iran and at the national level were 24%, 5%, 20%, 17%, and 6%, respectively. The prevalence rates of wasting in the central, western, southern, and northern parts of Iran and at the national level were 9%, 4%, 11%, 5%, and 4%, respectively.

Conclusion

Although the prevalence of underweight and wasting in Iran was low, some parts of the country showed high prevalence. The main reason behind this difference in the prevalence of malnutrition may be due to the level of development in different regions.

Introduction

Early childhood is the most important stage of a human’s life because mental and physical developments occur in this time period. Undernutrition in this stage can have irreversible effects on children’s growth and educational performance. Additionally, it could increase the risk of dying from infectious diseases [1]. Although reducing mortality rate among children below 5 years old was one of the main targets of the Millennium Development Goals, child mortality has remained a great concern worldwide especially in developing countries (the rate dropped from 90 to 43 deaths per 1,000 live births worldwide and from 100 to 47 deaths per 1,000 live births in developing countries between 1990 and 2015) [2].
Malnutrition refers to a condition that occurs when the body does not receive nutrients, resulting in acute or chronic deficiency or imbalance in energy, protein, and other nutrients [3-5]. Malnutrition is the main cause of mortality and morbidity among children below 5 years old; furthermore, this condition affects the physical and cognitive developments of children and reduces their academic performance [1]. Wasting and underweight are two main indicators of undernutrition in children [6]. The term underweight in children refers to a child whose weight for age is less than -2 standard deviation (SD) of the World Health Organization (WHO)’s child growth standard median [7]. In addition, the term wasting in children refers to a child whose weight for height is less than -2 SD of the WHO’s child growth standard median. Wasting refers to acute undernutrition, while underweight refers to acute and chronic malnutrition [7]. In 2013, the global prevalence rates of wasting and underweight among children below 5 years old were 8% and 15%, respectively [8]. The prevalence rates of wasting and underweight among Asian children were 10.1% and 19.3%, respectively [9]. The Millennium Development Goals report in 2015 stated that the worldwide prevalence of underweight decreased from 25% to 15% from 1990 to 2015; however, this decrease was not fast enough to reach the target [10]. In 2016, wasting continued to threaten the lives of 52 million children below 5 years old, which accounted for 7.7% of the total children below 5 years old in the world. In the same year, it was reported that over two-thirds of the wasted children were living in Asia [11].
Residing in rural areas, living in large family structure, poverty, low parental education, infections, socioeconomic status (SES), and living in developing countries are the main contributors to malnutrition [7,12,13]. With a population of almost 80 million people, 74% of which are urban dwellers, Iran is the 17th populous country in the world. Majority population of Iran is young. Adolescents below 15 years old account for nearly 25% of the population, while adults over 65 years old account for 6% of the population. The population size of children under 5 years old in Iran is almost 7 million, representing 8% of the population. Furthermore, the average annual population growth rate in the country from 2011 to 2016 was 1.24% [14,15].
Oil and natural gas along with agriculture and other industries are important contributors to Iran’s economy. Iran is the fourth producer and the fifth exporter of oil in the world. Iran is also the fifth producer of natural gas in the globe. Based on the World Bank’s criteria for classification of countries [16], with 1.485 trillion gross domestic product (GDP) per capita (GDP, purchasing power parity [constant 2011 international $]), Iran is considered as one of the upper middle-income countries [16].
To decrease the prevalence of malnutrition among children, a multisectoral nutrition program should be implemented. To evaluate this program and monitor the progress made in reaching the targets, data collection should be performed at national and subnational levels [11]. The prevalence of wasting and underweight have previously been reported in some provincial studies; in these studies, the reported prevalence rates of underweight were 2.3% in West Azerbaijani and 43.1% in North Khorasan, and the prevalence rates of wasting in children were 1.4% in West Azerbaijan and 32.2% in North Khorasan [17,18]. These studies differed in terms of design, geographical region, and age group, making it difficult to estimate the prevalence of wasting and underweight at the national level. This systematic review and meta-analysis aimed to estimate the prevalence of undernutrition at the national level in Iran.

Materials and methods

1. Search strategy

International databases including MEDLINE (PubMed), Web of Science, Google Scholar, Scopus, and CINHAL (Cumulative Index to Nursing and Allied Health Literature), as well as some Iranian databases including Scientific Information Database (www.sid.ir), Iranian Research Institute for Information Science and Technology (Irandoc.ac.ir), Iranmedex (www.iranmedex.com), and Magiran (www.magiran.com) were searched for related original articles. The search was conducted in these databases without any limitations on the language from January 1989 to August 2017. The search was also performed using the seven keywords in the form of English and Persian phrases including malnutrition, protein energy malnutrition, growth disorders, underweight, wasting, weight loss, children below 5 years old, and children. All keywords were searched electronically by two Boolean operators for whom the search strategy is explained separately.

2. Inclusion/exclusion criteria

After performing the search, all the results were reviewed; then, after going through the titles, some articles were excluded from the study. The evaluation of the searched articles was performed individually by 2 reviewers based on the inclusion and exclusion criteria. The structures of the searched articles were appraised using the reconstructed Preferred Reporting Items for Systematic Reviews and Meta-Analyses (PRISMA) checklist. This study included (1) cross-sectional studies; (2) articles that contain the estimated prevalence of malnutrition, growth disorders, underweight, wasting, and weight loss; and (3) articles that were conducted among children below 5 years old. The following studies were excluded articles: (1) interventional and other types of research that do not use a cross-sectional design, (2) animal articles, and (3) articles that reported on the prevalence of individuals aged more than 5 years.

3. Quality assessment and risk of bias

The quality of all of the articles was assessed using the Meta-analysis of Observational Studies in Epidemiology [19] and PRISMA checklist [20,21]. After evaluating the articles through the checklist supervised by the reviewing team, we made sure that our checklist includes the following: (1) name of first author; (2) date of publication; (3) date of when the study was performed; (4) total sample size; (5) sampling method; (6) study design; (7) sample size according to sex; (8) type of questionnaire; (9) appraisal tool score; (10) main variable; (11) prevalence of malnutrition, growth disorders, underweight, wasting, and weight loss based on the type of questionnaire; and (12) inclusion criteria.

4. Data extraction

A structured checklist was used to extract information on (1) name of first author; (2) date of publication; (3) date of performing study; (4) total sample size; (5) sampling method; (6) study design; (7) sample size according to sex; (8) type of questionnaire; (9) appraisal tool score; (10) main variable; (11) prevalence of malnutrition, growth disorders, overweight, obesity, and body weight based on the type of questionnaire; and (12) inclusion criteria. Additional information on the results was extracted based on the type of instruments.

5. Statistical analysis

A random effects model was employed to generate a pooled prevalence. The reported prevalence is presented in the form of percent with a 95% confidence interval (CI). The heterogeneity between the included studies was assessed using the heterogeneity statistic I2 and then was reported in the form of percent to indicate the extent of variation between the articles. A forest plot was also used to schematically display the results of the meta-analysis.

Results

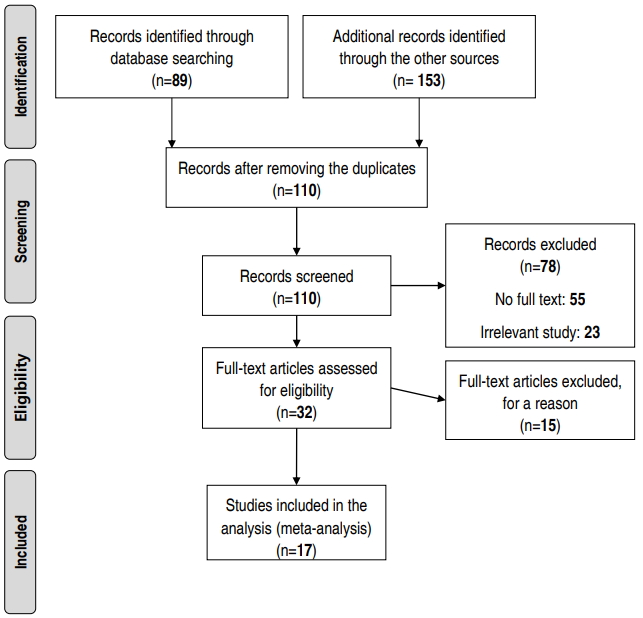
The primary search yielded 242 articles. After reviewing the titles, 132 papers were excluded due to duplication or relatedness. Approximately 110 relevant papers remained that were not duplicated. After reviewing the abstracts, 32 papers were included in the study. Then, the remaining articles were evaluated with accordance to the developed checklist and finally 15 other articles were excluded from the study (Fig. 1, Table 1). Based on the study methods (descriptive or analytical cross sectional), the articles were categorized into 2 groups.

1. Assessment of pooled prevalence

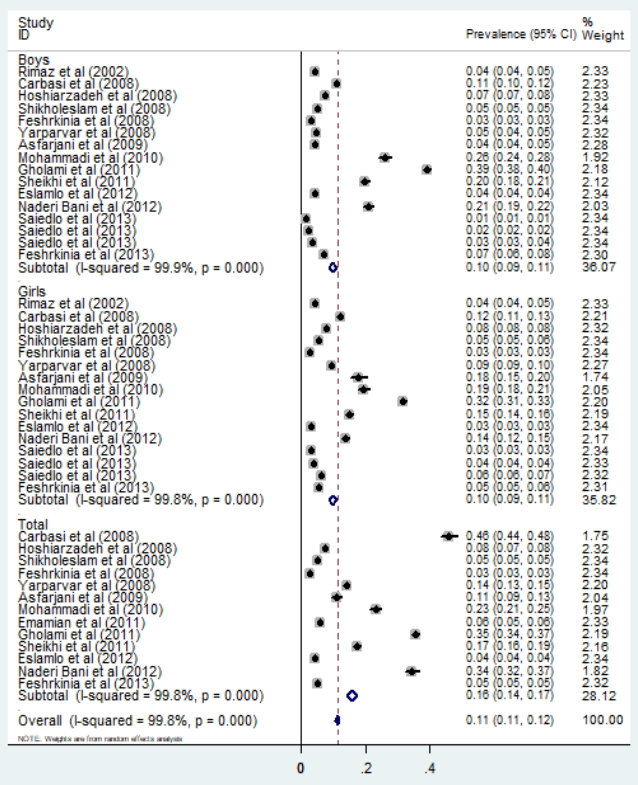
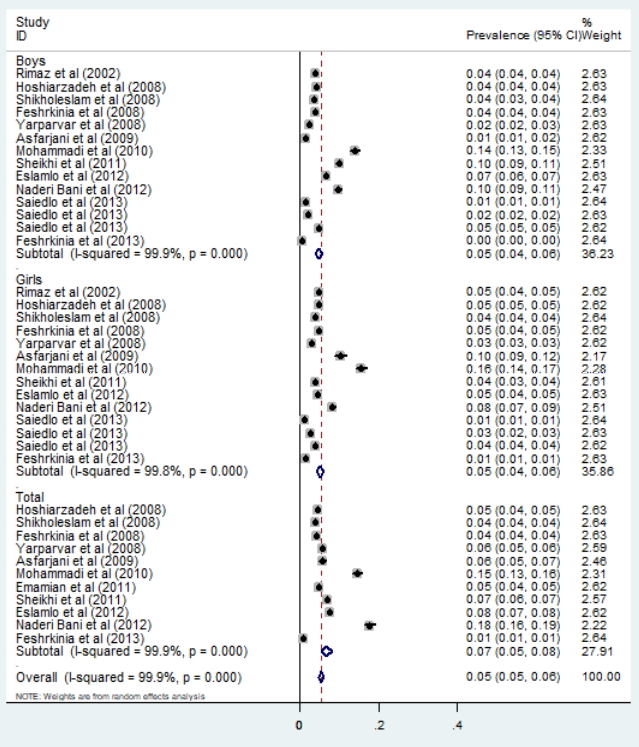
Finally, a total of 17 articles, from different settings, were included in the meta-analysis to obtain a pooled prevalence estimate. The prevalence of underweight in Iranian children was estimated to be 11% (95% CI, 11–12). A subgroups analysis of the sexes showed that the prevalence of underweight in men, women, and both were 10% (95% CI, 9–11), 10% (95% CI, 9–11), and 16% (95% CI, 14–17) respectively (Fig. 2). Moreover, the pooled prevalence of wasting in Iranian children was 5% (95% CI, 5–6) (Fig. 3). The subgroup analysis of the sexes showed that the prevalence rates in men, women, and both were 5% (95% CI, 4–6), 5% (95% CI, 4–6), and 7% (95% CI, 5–8), respectively (Fig. 3).
The results of this study showed that the prevalence rates of underweight among children in the central, western, southern, and northern areas in Iran and at the national level were 24% (95% CI, 7–41), 5% (95% CI, 4–5), 20% (95% CI, 14–26), 17% (95% CI, 4–30), and 6% (95% CI, 4–9), respectively (Table 2). In addition, the prevalence rates of wasting in the central, western, southern, and northern parts of the country and at the national level were 9% (95% CI, 4–15), 4% (95% CI, 1–7), 11% (95% CI, 3–18), 5% (95% CI, 4–6), and 4% (95% CI, 3–5), respectively (Table 2, Fig. 4).

2. Meta-regression

Meta-regression was used to explore the sources of between-study heterogeneities, including age and sample size. According to the results, the prevalence rates of wasting and underweight were associated with age (P<0.10) and sample size (P<0.10).

Discussion

The results of this study showed that the prevalence rates of underweight and wasting in Iranian children were 11% and 5%, respectively. However, in another study, the prevalence rates of underweight and wasting were reported to be 5.7% and 3.29%, respectively [22]. An anthropometric nutritional indicator survey conducted on Iranian preschool children in 1998 reported the underweight and wasting to be 10.8% and 4.9%, respectively [23]. A subgroup analysis of this study showed that the prevalence of underweight among children in the central, western, southern, and northern parts of Iran and at the national level were 24%, 5%, 20%, 17%, and 6%, respectively. Furthermore, the prevalence rates of wasting in the central, western, southern, and northern parts of the country and at the national level were 9%, 4%, 11%, 5%, and 4%, respectively. Several studies carried out at national, regional, and provincial levels reported different rates of underweight and wasting among Iranian children; for example, other studies in South Khorasan and Zahedan reported higher rates of wasting and underweight. According to these studies, 43.1% of children under 6 years old in the South Khorasan province were underweight, while 32.2% of them were wasted [18]; Additionally, in the rural parts of Zahedan, 17.3% of children under 6 years old were underweight, while 6.8% of them were wasted [24]. In another study, the prevalence of underweight and wasting in the central region was reported to be higher than that of the northwest and southern parts of the country [25].
The results of the present study showed the same prevalence of overweight and wasting among men and women. These results are also consistent with the those reported in other studies carried out in Iran, indicating that there is no statistical difference in the prevalence of underweight and wasting between sexes [25,26]. However, some studies reported that the prevalence of underweight and wasting in men were higher than that in women [3,27,28].
According to the WHO’s report [7], the prevalence of overweight in the southern region and at the national level in Iran is low, in the central region is medium, and in the western and northern parts of the country is high. Additionally, the prevalence of wasting in the western and central regions is low, in the southern region is high, and in the northern parts of the country and at the national level is scarce. Based on the Millennium Development Goals report published in 2015 [22], the prevalence of overweight at the national level in Iran is lower than the global prevalence and those in developing countries [22]. In this study, the subnational division was performed based on the geographical regions and SES of the parts of the country. Previous studies considered these two factors and employed the principle component analysis method to divide the country into four large regions. In this study, based on SES, Iranian regions were ranked from highest to lowest as follows: central, west, north-northeast, and southeast [29,30]. The prevalence of wasting is in accordance with the SES of these regions. For instance, the central and western regions with the highest SES had the lowest prevalence of overweight, and the southeast region with the lowest SES had the highest prevalence of wasting. However, this association was not observed in the prevalence of overweight.
One of the effective factors in estimating the prevalence of underweight and wasting, in different provinces of Iran, is GDP. GDP is the best indicator for measuring the prosperity in a society. It also shows the total income of the country as well as the total cost of producing commodities and providing services. Therefore, GDP per capita represents the means of income and expenditure for each person. Since most people seek more money and prosperity, GDP per capita can be used as a common indicator for measuring the economic prosperity of an individual. By employing the report published by the Islamic Parliament Research Center of the Islamic Republic of Iran, GDP was estimated for different provinces in the country, and then considering the share of GDP in each province, the total prevalence of underweight and wasting among children below 5 years old in these provinces was estimated and compared. As shown in the figure, the average GDP in the central provinces of Iran is higher than that in other provinces. However, the results of this study showed that the pooled estimates of the prevalence of underweight and wasting in the central and southern regions is higher than that in the other regions (west and east). Although the central areas have a high GDP share, the prevalence of underweight and wasting in the provinces in this region is higher than that in other provinces.
The following may be the reasons behind this contradiction:
Firstly, GDP cannot, at any rate, be employed to measure the level of children's health and educational quality. Secondly, the articles combined in this study to estimate the prevalence of underweight and wasting have high levels of heterogeneity, which can affect the overall results in different regions.
There are other factors that are varied among different regions in Iran and can affect the prevalence of underweight and wasting, including climate, rainfall variability (with the averages of 2,000 mm per year in the northern and western provinces, and 120 mm per year in the central and eastern provinces), and temperature variability (varied from -20°C in the northwest to 50°C in the south) [31]. These climate factors can influence the agriculture industry and the availability of food in the different parts of the country.
Health workforce distribution is a key factor in terms of measuring availability, coverage, and equity of health services. The study by Honarmand et al. [32] showed that in comparison with the other parts of the country, the number of general practitioners, midwives, pediatricians, and gynecologists working in the public sector are lower in the socioeconomically deprived provinces.
The prevalence of wasting and underweight has decreased over the recent years in Iran, and the main reasons behind this decrease are development of healthcare centers and improved access to the health services as well as implementation of primary health care network across the country [22]. According to the results of previous studies, the factors related to underweight and wasting were attributed to prematurity, intrauterine growth retardation, small for gestational age, lack of appropriate and sufficient feeding of infants by mothers’ milk and colostrum, and inadequate health education [33,34].
The results of this study indicated that although the prevalence of underweight and wasting in Iran was low, some regions of the country showed a high prevalence. The main reason for this difference in the prevalence of malnutrition between the regions and provinces is the level of development. Therefore, community-based interventions should be implemented to improve child and mother nutrition in these regions. These interventions improve maternal nutrition before, during, and after pregnancy, along with early initiation of breastfeeding, exclusive breastfeeding, and complementary feeding.

Conflicts of interest

No potential conflict of interest relevant to this article was reported.

Fig. 1.
Flow diagram of the literature search and study selection.
kjp-2018-61-8-231f1.jpg
Fig. 2.
Meta-analysis of the prevalence of underweight in Iranian children by sex.
kjp-2018-61-8-231f2.jpg
Fig. 3.
Meta-analysis of the prevalence of wasting in Iranian children by sex.
kjp-2018-61-8-231f3.jpg
Fig. 4.
Gross domestic product (GDP) per province in association with prevalence of wasting and underweight. Northeast: Ardabil, East Azerbaijan, West Azerbaijan, Zanjan, Gilan, Golestan, Mazandaran, and Qazvin provinces (GDP average is 94081.73 billion rials). Western: Hamadan, Ilam, Kermanshah, Kurdistan, and Lorestan provinces (GDP average is 91943.77 billion rials). Southern: Bushehr, Fars, Hormozgan, Kerman, Khuzestan, Sistan and Baluchestan, and South Khorasan (GDP average is 155731.4 billion rials). Central: Chaharmahal and Bakhtiari, Isfahan, Kohgiluyeh and Boyer-Ahmad, Markazi, Qom, Semnan, Tehran, and Yazd provinces (GDP average is 150563.2 billion rials). Eastern: North Khorasan and Razavi Khorasan provinces (GDP average is 79879.01 Billion Rials). Reference from Statistical Center of Iran (https://www.amar.org.ir/english).
kjp-2018-61-8-231f4.jpg
Table 1.
Characteristics of the studies included in the meta-analysis
Study Year Sample size Type of study Measurement City Sex Prevalence (%)
Underweight Wasting
Akhavan-Karbasi et al. [35] 2008 400 Cross sectional NCHS/WHO Yazd Male - 11 (10–12)
Female - 12 (11–13)
Total - 46 (44–48)
Houshiar et al. [36] 2009 1,417 Cross sectional NCHS/WHO Iran Male 4.2 (4–4.5) 7.3 (7–8)
Female 4.8 (4.6–5) 8 (8–8)
Total 4.5 (4–5) 7.6 (7–8)
Emamian et al. [37] 2011 1,395 Cross sectional NCHS/WHO Semnan Male - -
Female - -
Total 4.7 (4.4–5) 5.7 (5–6)
Farrokh-Eslamlou et al. [38] 2013 3,341 Cross sectional NCHS/WHO West Azerbaijan Male 6.7 (6.4–7) 4.1 (4–4.2)
Female 4.6 (4.4–4.8) 3.2 (3–3.5)
Total 7.5 (7–8) 4.3 (4–4.5)
Sheikholeslam et al. [39] 2008 34,200 Cross sectional NCHS/WHO Iran Male 3.5 (4–4) 5 (5–5)
Female 3.9 (3.7–4.1) 5.5 (5–6)
Total 3.7 (3.8–3.9) 5.2 (5–5.5)
Naderi Bani et al. [40] 2013 384 Cross sectional NCHS/WHO Isfahan Male 9.7 (9–11) 20.8 (19–22)
Female 8.2 (7–9) 13.6 (12–15)
Total 17.8 (16–19) 34.5 (32–37)
Mohammadi et al. [41] 2011 370 Cross sectional NCHS/WHO Sistan and Baluchestan Male 13.9 (13–15.1) 25.9 (24–28)
Female 15.6 (14–17.2) 19.5 (18–21)
Total 14.6 (13–16.2) 23.2 (21–25)
Rimaz et al. [42] 2005 1,243 Cross sectional NCHS/WHO Alborz Male 3.7 (3.6–3.8) 4.4 (4–5)
Female 4.7 (4.4–5) 4.4 (4–5)
Total - -
Nouri Saeidlou et al. [43] 2014 902 Cross sectional NCHS/WHO West Azerbaijan Male 1.3 (1.1–1.5) 1.3 (1–1.5)
Female 1.1 (0.9–1.3) 2.9 (2.8–3)
Total - -
Nouri Saeidlou et al. [43] 2014 902 Cross sectional NCHS/WHO Kermanshah Male 2 (1.8–2.2) 2.2 (2–2.4)
Female 2.6 (2.4–2.8) 4 (3.8–4.2)
Total - -
Nouri Saeidlou et al. [43] 2014 902 Cross sectional NCHS/WHO Isfahan Male 4.8 (4.6–5) 3.3 (3–4)
Female 3.9 (3.7–4.1) 6.3 (6–7)
Total - -
Fesharakinia et al. [44] 2008 1,303 Cross sectional NCHS/WHO South Khorasan Male 3.7 (3.5–3.9) 2.9 (2.7–3.1)
Female 4.7 (4.4–5) 2.7 (2.6–2.8)
Total 4.2 (4–4.4) 2.8 (2.7–2.9)
Yarparvar et al. [45] 2006 500 Cross sectional NCHS/WHO Kerman Male 2.4 (2.2–2.6) 4.8 (4–5.2)
Female 2.8 (2.6–3) 9.5(9–10)
Total 5.6 (5.4–5.8) 14 (13–15)
Esfarjani et al. [46] 2008 137 Cross sectional NCHS/WHO Tehran Male 1.4 (1.1–1.7) 4.3 (4–5)
Female 10.4 (9–11.8) 17.9 (15–20)
Total 5.8 (5–6.6) 10.9 (9–13)
Gholami et al. [47] 2014 1,621 Cross sectional NCHS/WHO Khorasan Male - 39 (38–40)
Female - 31.7 (31–33)
Total - 35.5 (34–37)
Fesharakinia et al. [48] 2013 480 Cross sectional NCHS/WHO South Khorasan Male 0.4 (0.3–0.5) 7 (6–8)
Female 1.3 (1.1–1.5) 5.5 (5–6)
Total 0.8 (0.6–1) 5 (4.7–5.3)
Mahdieh et al. [24] 2013 514 Cross sectional NCHS/WHO Zahedan Male 9.9 (9–10.8) 19.8(18–21)
Female 3.8 (3.4–4.2) 14.9 (14–16)
Total 6.8 (6.4–7.2) 17.3 (16–19)

NCHS, National Center for Health Statistics; WHO, World Health Organization.

Table 2.
Summary of the estimated prevalence (with 95% confidence intervals [CIs]) of underweight and wasting in Iranian children by regions
Variable No. of studies Prevalence (95% CI) Between studies
Between subgroups
I2 P heterogeneity Q P heterogeneity
Underweight 17.08 0.0001
 Central 4 24% (7–41) 99.8% 0.0001
 Western 2 5% (4–5) 89.4% 0.002
 Southern 2 20% (14–26) 96.4% 0.0001
 Northeast 3 17% (4–30) 99.6% 0.0001
 Total 2 6% (4–9) 99.4% 0.0001
Wasting 16.98 0.0001
 Central 3 9% (4–15) 99.3% 0.0001
 Western 2 4% (1–7) 99.9% 0.001
 Southern 2 11% (3–18) 99.2% 0.0001
 Northeast 2 5% (4–6) 96.5% 0.0001
 Total 2 4% (3–5) 97.9% 0.0001

References

1. Akombi BJ, Agho KE, Merom D, Renzaho AM, Hall JJ. Child malnutrition in sub-Saharan Africa: a meta-analysis of demographic and health surveys (2006-2016). PLoS One 2017;12:e0177338.
crossref pmid pmc
2. Anand A, Roy N. Transitioning toward Sustainable Development Goals: the role of household environment in influencing child health in Sub-Saharan Africa and South Asia using recent demographic health surveys. Front Public Health 2016;4:87
crossref pmid pmc
3. Mutua RN, Keriko J, Mutai J. Factors associated with stunting, wasting and underweight among children aged 2-5 years in early childhood development and education centers in masinga sub county, machakos county. Eur J Health Sci 2017;1:44–69.
crossref
4. Black RE, Victora CG, Walker SP, Bhutta ZA, Christian P, de Onis M, et al. Maternal and child undernutrition and overweight in low-income and middle-income countries. Lancet 2013;382:427–51.
crossref pmid
5. Mohseni M, Aryankhesal A, Kalantari N. Factors associated with malnutrition among under five-year-old children in Iran: a systematic review. Ann Trop Med Pub Health 2017;10:1147
crossref
6. Ngwira A, Munthali ECS, Vwalika KD. Analysis on the association among stunting, wasting and underweight in Malawi: an application of a log-linear model for the three-way table. J Public Health Afr 2017;8:620
crossref pmid pmc
7. World Health Organization. NLIS country profile indicators interpretation guide. Geneva (Switzerland): World Health Organization, 2010.

8. Mgongo M, Chotta NAS, Hashim TH, Uriyo JG, Damian DJ, Stray-Pedersen B, et al. Underweight, stunting and wasting among children in Kilimanjaro Region, Tanzania; a population-based cross-sectional study. Int J Environ Res Public Health 2017;14.
crossref
9. UNICEF, Research and Policy, Data and Analytics Section of the Division of Data; WHO, Department of Nutrition for Health and Development; World Bank, Development Data Group. Levels and trends in child malnutrition: UNICEF-WHO-the world bank joint child malnutrition estimates. [New York]: United Nations Children’s Fund, the World Health Organization, and World Bank Group, 2012.

10. Iams JD, Goldenberg RL, Meis PJ, Mercer BM, Moawad A, Das A, et al. The length of the cervix and the risk of spontaneous premature delivery. National Institute of Child Health and Human Development Maternal Fetal Medicine Unit Network. N Engl J Med 1996;334:567–72.
crossref pmid
11. UNICEF, Research and Policy, Data and Analytics Section of the Division of Data; WHO, Department of Nutrition for Health and Development; World Bank, Development Data Group. Levels and trends in child malnutrition in UNICEF/WHO/World Bank Group joint child malnutrition estimates key findings of the 2016 edition. [New York]: United Nations Children’s Fund, the World Health Organization, and World Bank Group, 2017.

12. Dewey KG, Mayers DR. Early child growth: how do nutrition and infection interact? Matern Child Nutr 2011;7 Suppl 3:129–42.
crossref pmid
13. Amugsi DA, Mittelmark MB, Lartey A, Matanda DJ, Urke HB. Influence ofchildcare practices on nutritional status of Ghanaian children: a regression analysis of the Ghana Demographic and Health Surveys. BMJ Open 2014;4:e005340.
crossref pmid pmc
14. Ebrahimi M, Mansournia MA, Haghdoost AA, Abazari A, Alaeddini F, Mirzazadeh A, et al. Social disparities in prevalence, treatment and control of hypertension in Iran: second National Surveillance of Risk Factors of Noncommunicable Diseases, 2006. J Hypertens 2010;28:1620–9.
crossref pmid
15. Sadjadi A, Malekzadeh R, Derakhshan MH, Sepehr A, Nouraie M, Sotoudeh M, et al. Cancer occurrence in Ardabil: results of a population-based cancer registry from Iran. Int J Cancer 2003;107:113–8.
crossref pmid
16. Mehrdad R. Health system in Iran. JMAJ 2009;52:69–73.

17. Nouri Saeidlou S, Babaei F, Ayremlou P. Malnutrition, overweight, and obesity among urban and rural children in north of west Azerbijan, Iran. J Obes 2014;2014:541213
crossref pmid pmc pdf
18. Sharifzadeh G, Mehrjoofard H, Raghebi S. Prevalence of Malnutrition in under 6-year Olds in South Khorasan, Iran. Iran J Pediatr 2010;20:435–41.
pmid pmc
19. Stroup DF, Berlin JA, Morton SC, Olkin I, Williamson GD, Rennie D, et al. Meta-analysis of observational studies in epidemiology: a proposal for reporting. Meta-analysis Of Observational Studies in Epidemiology (MOOSE) group. JAMA 2000;283:2008–12.
crossref pmid
20. Moher D, Liberati A, Tetzlaff J, Altman DG, PRISMA Group. Preferred reporting items for systematic reviews and meta-analyses: the PRISMA statement. PLoS Med 2009;6:e1000097.
crossref pmid pmc
21. Liberati A, Altman DG, Tetzlaff J, Mulrow C, Gøtzsche PC, Ioannidis JP, et al. The PRISMA statement for reporting systematic reviews and meta-analyses of studies that evaluate health care interventions: explanation and elaboration. PLoS Med 2009;6:e1000100.
crossref pmid pmc
22. Almasian Kia A, Rezapour A, Khosravi A, Afzali Abarghouei V. Socioeconomic inequality in malnutrition in under-5 children in Iran: evidence from the multiple indicator demographic and health survey, 2010. J Prev Med Public Health 2017;50:201–9.
crossref pmid pmc pdf
23. Crowley P. Interventions for preventing or improving the outcome of delivery at or beyond term. Cochrane Database Syst Rev 2000;(2): CD000170Review. Update in: Cochrane Database Syst Rev 2006;(4):CD000170.
crossref pmid
24. Mahdieh S, Monir EN, Maryam H, Ahmad E. Prevalence of stunting, underweight and wasting according to national center for health statistics criteria in rural children aged under six years in zahedan, Iran, in 2010. Health Syst Res 2013;9:153–8.

25. Nouri Saeidlou S, Babaei F, Ayremlou P. Children malnutrition in northwestern, central and southern regions of Iran: does geographic location matter? Glob J Health Sci 2014;6:36–41.
crossref pmid pmc
26. Kavosi E, Hassanzadeh Rostami Z, Kavosi Z, Nasihatkon A, Moghadami M, Heidari M. Prevalence and determinants of under-nutrition among children under six: a cross-sectional survey in Fars province, Iran. Int J Health Policy Manag 2014;3:71–6.
crossref pmid pmc pdf
27. Akombi BJ, Agho KE, Merom D, Hall JJ, Renzaho AM. Multilevel analysis of factors associated with wasting and underweight among children under-five year in Nigeria. Nutrients 2017;9.
crossref
28. Dabale GA, Sharma M. Determinants of wasting among under-five children in Ethiopia: (a multilevel logistic regression model approach). Int J Stat Med Res 2014;3:368–77.
crossref
29. Bahreynian M, Motlagh ME, Qorbani M, Heshmat R, Ardalan G, Kelishadi R. Prevalence of growth disorders in a nationally representative sample of iranian adolescents according to socioeconomic status: The CASPIAN-III Study. Pediatr Neonatol 2015;56:242–7.
crossref pmid
30. Farzadfar F, Danaei G, Namdaritabar H, Rajaratnam JK, Marcus JR, Khosravi A, et al. National and subnational mortality effects of metabolic risk factors and smoking in Iran: a comparative risk assessment. Popul Health Metr 2011;9:55
crossref pmid pmc
31. Abbaspour KC, Faramarzi M, Ghasemi SS, Yang H. Assessing the impact of climate change on water resources in Iran. Water Resour Res 2009;45:W10434
crossref
32. Honarmand R, Mozhdehifard M, Kavosi Z. Geographic distribution indices of general practitioners, midwives, pediatricians, and gynecologists in the public sector of Iran. Electron Physician 2017;9:4584–9.
crossref pmid pmc pdf
33. Ergin F, Okyay P, Atasoylu G, Beşer E. Nutritional status and risk factors of chronic malnutrition in children under five years of age in Aydin, a western city of Turkey. Turk J Pediatr 2007;49:283–9.
pmid
34. Gernaat HB, Dechering WH, Voorhoeve HW. Physical growth of children under five years of age in Nchelenge, Zambia: results from a district survey. Am J Phys Anthropol 1996;100:473–85.
crossref pmid
35. Akhavan- Karbasi S, Fallah R, Golestan M, Sadr-Bafghi M. Prevalence and risk factors of obesity and overweight among primary school children in yazd. J Shahid Sadoughi Univ Med Sci 2009;16:8–13.

36. Houshiar Rad A, Dorosty AR, Kalantari N, Abdollahi M, Abtahi M. Prevalence of stunting, underweight, wasting and overweight among iranian under-five-year-old children (2000-2002). Iran J Nutr Sci Food Technol 2009;3:49–56.

37. Emamian MH, Gorgani N, Fateh M. Malnutrition status in children of Shahroud, Iran. Knowl Health 2011;6:7–14.

38. Farrokh-Eslamlou HR, Oshnouei S, Ahmadi N, Babaei F. Geographical distribution of nutrition deficiency among children under five years old in the west Azerbaijan province, Iran. Urmia Med J 2013;24:201–9.

39. Sheikholeslam R, Naghavi M, Abdollahi Z, Zarati M, Vaseghi S, Sadeghi Ghotbabadi F, et al. Current status and the 10 years trend in the malnutrition indexes of children under 5 years in Iran. Iran J Epidemiol 2008;4:21–8.

40. Naderi Beni M, Lak R, Jazaeri S, Eftekhar Ardebili H. Prevalence of malnutrition under five years in Chadegan (area district city) Iran 2011. Iran J Epidemiol 2013;9:22–8.

41. Mohammadi MH, Ramazani A, Baharnouri Rahmatabadi R. Survey of nutritional status and some related factors in under 5 years pediatrics, hospitalized in teaching hospitals of Zabol on 2010. J Zabol Univ Med Sci Health Serv 2011;3:73–84.

42. Rimaz S, Moghtaderi A, Shidfar F, Poor Malek F. Prevalence and determinants of protein-energy malnutrition among children under the age of 5 in Savojbolagh (2002-2003). Razi J Med Sci 2005;12:97–105.

43. Nouri Saeidlou S, Babaei F, Ayremlou P. Prevalence of malnutrition in children under 5 years old in Salmas, and comparing to Ravansar and Samirom. Razi J Med Sci 2014;21:47–53.

44. Fesharakinia A, Sharifzadeh G, Zarban A. Investigation of nutritional status in elementary school students of south Khorasan province: east of Iran. Qom Univ Med Sci J 2008;2:47–52.

45. Yarparvar A, Omidvar N, Golestan B, Kalantari N. Assessing the nutritional status of the preschool 6-59 month old children and some related factors in earthquake affected areas of Bam. Iran J Nutr Scie Food Technol 2006;1:33–43.

46. Esfarjani F, Salarkia N, Roustaee R, Abadi A. Anthropometric assessment of the nutritional status of under-5-year-old children in mother-headed households under coverage of the Imam Khomeini relief foundation of Tehran and factors related to it, 2005. Iran J Nutr Scie Food Technol 2008;2:41–8.

47. Gholami A, Shorvarzi L, Rastegari A, Taghavi Rad A. Prevalence of underweight among rural children aged 3 to 6 year old in neyshabur. J Neyshabur Univ Med Sci 2014;1:10–3.

48. Fesharakinia A, Sharifzadeh G. Prevalence of malnutrition in under 5-year old children in birjand city in 2011. J Birjand Univ Med Sci 2013;20:77–84.

METRICS Graph View
  • 2 Crossref
  • 4 Scopus
  • 9,386 View
  • 220 Download